Tổng hợp chia sẻ hơn 20+ Khoá học Data Visualization miễn phí, download sử dụng vĩnh viễn (mới cập nhật).
Khoá học Data Visualization là gì?
Khóa học về trực quan hóa dữ liệu thường tập trung vào việc giảng dạy cách hiển thị và truyền đạt thông tin một cách hiệu quả thông qua các phương tiện trực quan. Các chủ đề trong khóa học có thể bao gồm:
- Nguyên tắc cơ bản của trực quan hóa dữ liệu: Nắm vững các nguyên tắc cơ bản như chọn lựa biểu đồ và đồ thị phù hợp, giải thích dữ liệu một cách chính xác và thiết kế trực quan hóa hiệu quả.
- Công cụ và phần mềm: Học cách sử dụng các công cụ và phần mềm phổ biến như Tableau, Power BI, Excel, hoặc ngôn ngữ lập trình như Python (với Matplotlib, Seaborn, Plotly) và R (với ggplot2).
- Chuẩn bị dữ liệu: Xử lý và làm sạch dữ liệu, xử lý giá trị còn thiếu và chuyển đổi dữ liệu để phù hợp với trình bày.
- Hình ảnh tương tác: Tạo hình ảnh tương tác để người dùng có thể khám phá và tương tác với dữ liệu.
- Kể chuyện qua dữ liệu: Hiểu cách kể chuyện thông qua dữ liệu, làm nổi bật tầm quan trọng của câu chuyện rõ ràng và hình ảnh trực quan để truyền đạt thông tin chi tiết.
- Lý thuyết màu sắc và nguyên tắc thiết kế: Khám phá sự lựa chọn màu sắc, yếu tố thiết kế và nguyên tắc để tạo ra hình ảnh trực quan hấp dẫn và hiệu quả.
- Nghiên cứu điển hình và ứng dụng thực tế: Phân tích ví dụ và nghiên cứu trong thực tế để hiểu cách sử dụng trực quan hóa dữ liệu trong các ngành và ứng dụng khác nhau.
- Cân nhắc đạo đức: Thảo luận về mặt đạo đức của trực quan hóa dữ liệu, bao gồm tránh trình bày thông tin sai lệch và đảm bảo tính minh bạch.
Các khóa học có thể khác nhau về độ sâu và độ phức tạp, phù hợp cho người mới học cũng như những người có kỹ năng nâng cao hơn. Chúng có thể được tổ chức bởi trường đại học, các nền tảng trực tuyến hoặc tổ chức đào tạo. Một số khóa học có thể cấp chứng chỉ sau khi hoàn thành, chứng minh mức độ thành thạo về kỹ thuật trực quan hóa dữ liệu.
✅ Xem thêm:
- Khóa học làm PowerPoint bằng AI miễn phí
- Khóa học PowerPoint miễn phí cập nhật và tổng hợp)
- Tài liệu VBA Excel miễn phí (tổng hợp)
- Khóa học Excel miễn phí – Nâng cao kỹ năng văn phòng của bạn
- Data Analyst Skillpath: Zero to Hero in Excel, SQL &; Python | Free
- Khóa học Busines Analysis Online miễn phí cho người mới bắt đầu
- 15+ Khóa học UI/UX online free
- [Free] Khoá học Data Visualization miễn phí
- Data Visualization là gì? Khóa học Data Visualization free
- Khóa học Power BI miễn phí: Phân tích, trực quan hóa dữ liệu
✅ Xem thêm:
- Hướng dẫn sử dụng Advanced Custom Fields – Key kích hoạt ACF PRO
- 60+ khóa học ChatGPT miễn phí tốt nhất (tổng hợp)
- Link Whisper là gì? Top Plugin tạo Internal Link WordPress tự động [SEO]
Chia sẻ Khoá học Data Visualization miễn phí
Dưới đây mình sẽ chia sẻ link đăng ký ưu đãi sử dụng vĩnh viễn các Khoá học Data Visualization từ các nền tảng đào tạo trực tuyến như Udemy,.com,…
Link đăng ký là miễn phí truy cập vĩnh viễn (bao gồm lấy chứng chỉ). Đối với Udemy, các bạn có thể tham khảo các đăng ký khóa học Udemy miễn phí ở bài viết sau:
Data Analytics and Visualization Using Excel, Python
Unlocking Insights through Data: Mastering Analytics and Visualization for In-Demand Tech Proficiency. source: udemy.com
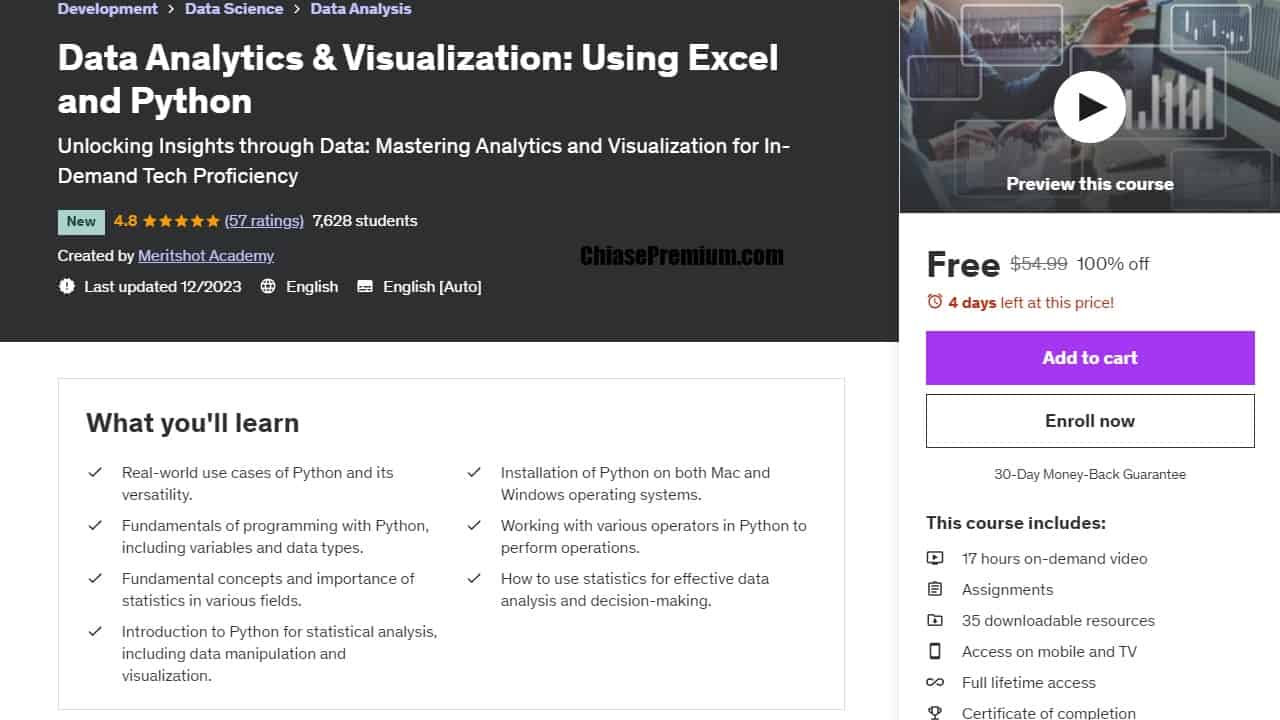
- 17 hours on-demand video
- Assignments
- 35 downloadable resources
- Access on mobile and TV
- Full lifetime access
- Certificate of completion
“What you’ll learn
- Real-world use cases of Python and its versatility.
- Installation of Python on both Mac and Windows operating systems.
- Fundamentals of programming with Python, including variables and data types.
- Working with various operators in Python to perform operations.
- Fundamental concepts and importance of statistics in various fields.
- How to use statistics for effective data analysis and decision-making.
- Introduction to Python for statistical analysis, including data manipulation and visualization.
Embark on a transformative journey into the dynamic realm of Data Analytics and Visualization, where you will acquire essential and sought-after tech skills. This comprehensive course is designed to empower you with proficiency in key tools and methodologies, including Python programming, Excel, statistical analysis, data analysis, and data visualization.
Key Learning Objectives:
– Gain hands-on experience in Python, a powerful and versatile programming language widely used for data analysis and manipulation.
– Learn to leverage Python libraries such as Pandas and NumPy for efficient data handling and manipulation.
– Develop advanced skills in Excel, exploring its robust features for data organization, analysis, and visualization.
– Harness the power of Excel functions and formulas to extract insights from complex datasets.
– Acquire a solid foundation in statistical concepts and techniques essential for making informed decisions based on data.
– Apply statistical methods to interpret and draw meaningful conclusions from data sets.
– Explore the entire data analysis process, from data cleaning and preprocessing to exploratory data analysis (EDA) and feature engineering.
– Learn how to identify patterns, outliers, and trends within datasets, enabling you to extract valuable insights.
– Master the art of presenting data visually through a variety of visualization tools and techniques.
– Use industry-standard tools like Matplotlib and Seaborn to create compelling and informative data visualizations.
Upon completion, you will possess a well-rounded skill set in data analytics and visualization, equipping you to tackle real-world challenges and contribute meaningfully to data-driven decision-making in any professional setting. Join us on this journey to become a proficient and sought-after tech professional in the field of data analytics and visualization.
Who this course is for:
- Beginners with no prior programming experience.
- Students or professionals in various fields, including business, science, social sciences, and healthcare, who want to enhance their data analysis skills.
- Anyone interested in automating tasks or data analysis.
- Data analysts, researchers, and scientists seeking to strengthen their statistical foundations and Python programming skills.
- Beginners with no prior statistical knowledge but with a curiosity to learn and apply statistical methods.
- Professionals looking to advance their career by acquiring valuable statistical and data analysis skills.”
source: udemy.com
Link đăng ký miễn phí vĩnh viễn dành cho 120 đăng ký đầu tiên trong hôm nay (free for 120 enrolls today), 09.01.2024: https://www.udemy.com/course/data-analytics-visualization-acquire-demanded-tech-skills/?couponCode=C4BF5BEDDD0E707967A4
Data Visualization in Tableau và Python
(2 Courses in 1)
Learn Data Visualization with Tableau & Python from the basic to advanced level using Real-Life Projects. source: udemy.com
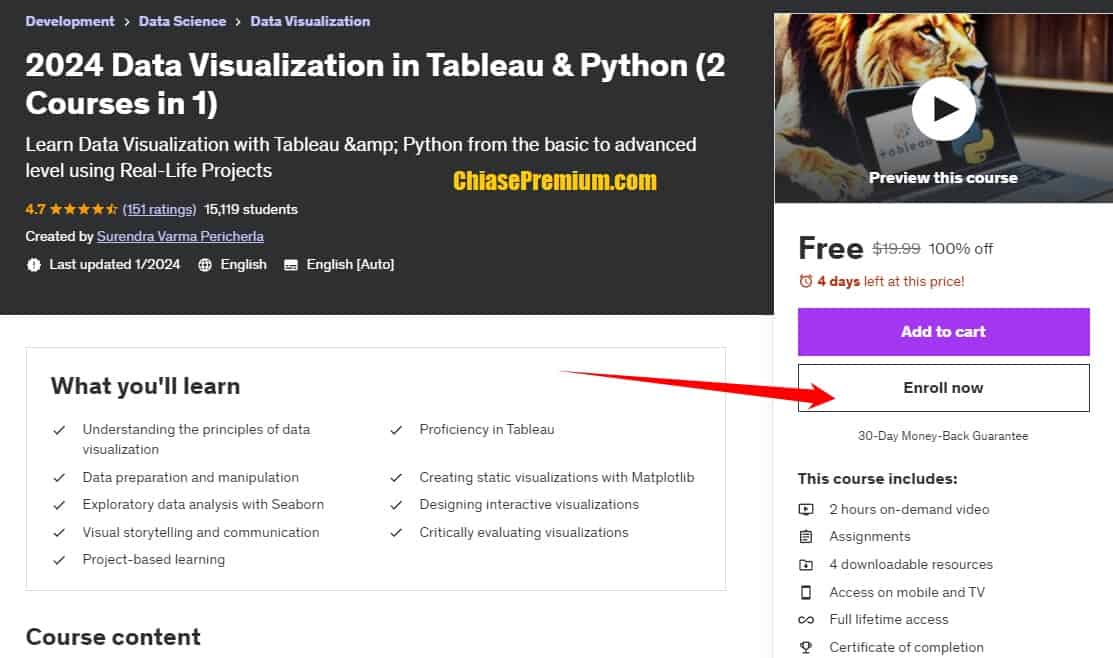
“What you’ll learn
- Understanding the principles of data visualization
- Proficiency in Tableau
- Data preparation and manipulation
- Creating static visualizations with Matplotlib
- Exploratory data analysis with Seaborn
- Designing interactive visualizations
- Visual storytelling and communication
- Critically evaluating visualizations
- Project-based learning” source: udemy.com
“Course Features:
- Practical Approach: This course focuses on hands-on learning through practical exercises and real-world examples. You will work on various datasets, allowing you to apply the concepts and techniques learned directly to relevant scenarios.
- Comprehensive Coverage: The course covers both Tableau and Python libraries, providing you with a well-rounded understanding of data visualization. You will learn the fundamentals of each tool and progressively advance to more advanced techniques, ensuring a thorough grasp of the subject matter.
- Tableau Proficiency: You will gain proficiency in Tableau, a widely used data visualization tool. Starting with the basics, you will learn to create interactive dashboards, design captivating visualizations, and explore advanced functionalities for data analysis and storytelling.
- Python Visualization: Explore the capabilities of Python libraries, Matplotlib and Seaborn, for data visualization. You will learn to create static visualizations, customize plots, handle data manipulation, and leverage advanced statistical visualization techniques.
- Data Preparation and Cleaning: An essential aspect of data visualization is data preparation. This course covers techniques for data cleaning, manipulation, and transformation to ensure high-quality data for visualization purposes.
- Storytelling and Communication: Learn how to tell compelling stories through data visualization. Discover effective techniques for communicating insights visually and creating impactful narratives that engage and persuade your audience.
- Real-World Projects: Apply your skills to real-world projects and datasets, allowing you to showcase your abilities and build a portfolio of impressive visualizations. Gain practical experience and confidence in creating visualizations that address real-world challenges.
- Support and Resources: The course provides continuous support through Q&A sessions and a dedicated community forum, where you can interact with the instructor and fellow learners. Additional resources, such as code samples, datasets, and reference materials, will be provided to supplement your learning.
- Lifetime Access: Gain lifetime access to the course materials, including updates and new content. You can revisit the course anytime to refresh your knowledge, access new resources, and stay up-to-date with the latest advancements in data visualization.
- Certificate of Completion: Upon completing the course, you will receive a certificate of completion, validating your skills in data visualization with Tableau and Python libraries.
Whether you are a data analyst, data scientist, business professional, researcher, or anyone interested in mastering data visualization, this course will equip you with the necessary tools and knowledge to create impactful visualizations that drive insights and enhance data-driven decision-making.” source: udemy.com
Link đăng ký miễn phí vĩnh viễn dành cho 120 đăng ký đầu tiên trong hôm nay (free for 120 enrolls today), 11.01.2024: https://www.udemy.com/course/2023-data-visualization-in-tableau-python-2-courses-in-1/?couponCode=2C2FEC6C88459234776C
Khoá học Data Visualization miễn phí với Python
New Methods in Data Visualization with Python
Step-by-step training for 3D and advanced visualization in python and Matplotlib (with all the codes). source: udemy.com
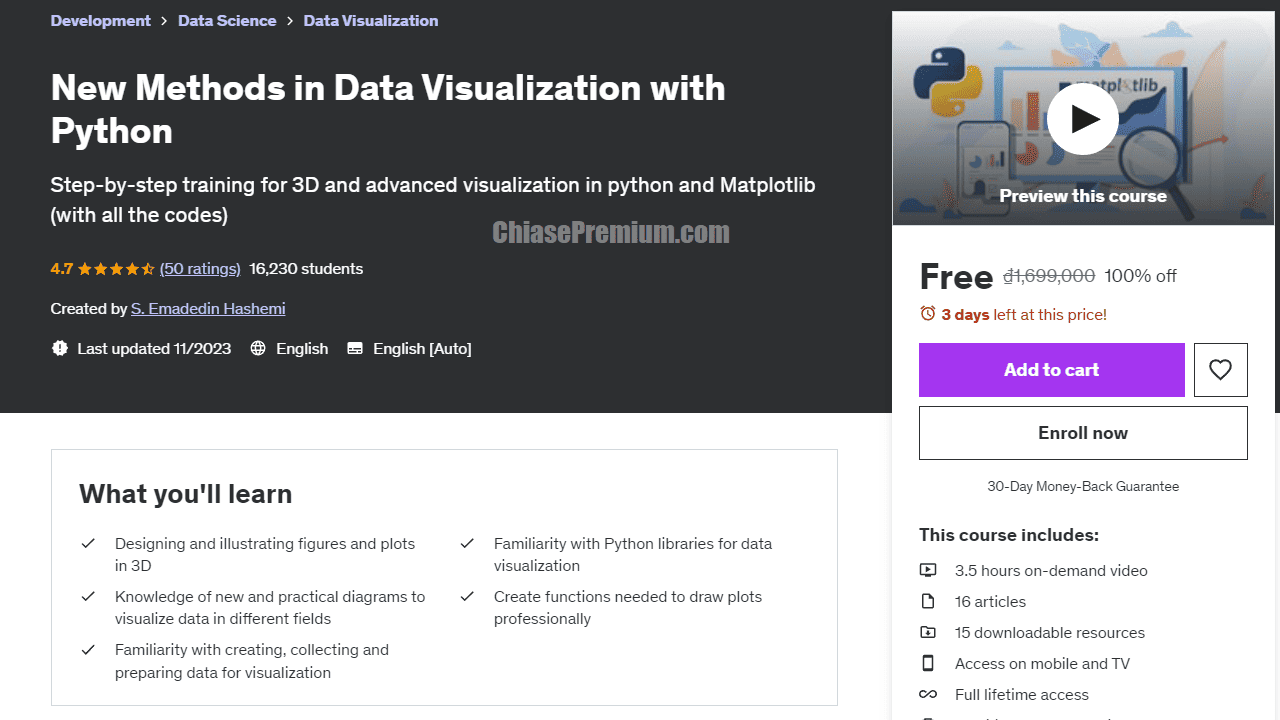
- 3.5 hours on-demand video
- 16 articles
- 15 downloadable resources
What you’ll learn
- “Designing and illustrating figures and plots in 3D
- Familiarity with Python libraries for data visualization
- Knowledge of new and practical diagrams to visualize data in different fields
- Create functions needed to draw plots professionally
- Familiarity with creating, collecting and preparing data for visualization
Due to the importance of data visualization, there are many pieces of training on this subject that teach basic and preliminary data visualization. But in this course, we will teach you how to visualize your data in an advanced way in Python. In this course, we even teach 3D visualization so that you can specifically visualize your data and draw graphs using Python codes.
You can use this course to visualize your data for managers, scientific papers, work projects, university classes, personal websites, and even advertisements.
In today’s world, a lot of data is being generated on a daily basis. And sometimes to analyze this data for certain trends, and patterns may become difficult if the data is in its raw format. To overcome this data visualization comes into play. Data visualization provides a good, organized pictorial representation of the data which makes it easier to understand, observe, and analyze. In this course, we will discuss how to advanced visualize data using Python.
This is just one demonstration of the usefulness of data visualization that makes it so popular in data science. Let’s see some more reasons why data visualization is so important:
- Data Visualization Discovers the Trends in Data
- Data Visualization is Interactive
- Data Visualization Provides a Perspective on the Data
- Data Visualization Explains a Data Process
- Data Visualization Strokes the Imagination
- Data Visualization Tells a Data Story
- Data Visualization Puts the Data into the Correct Context
- Data Visualization is Educational for Users
- Data Visualization Saves Time
- Data Visualization Presents Data Beautifully
All of these reasons demonstrate the importance of data visualization in data science. Basically, it is a much more user-friendly method to understand the data and also demonstrates the trends and patterns in the data to other people. And it doesn’t hurt that data visualization is beautiful to look at and so more appealing to people than rows of boring data!”
source: udemy.com
Link đăng ký miễn phí vĩnh viễn dành cho 120 đăng ký đầu tiên trong hôm nay (free for 120 enrolls today), trong ngày 21/2/2024: https://www.udemy.com/course/advanced-data-visualization-with-python/?couponCode=EE7BF841B2F17C627613
Data Visualization with Python and New Methods in Matplotlib
Step-by-step training for 3D and advanced visualization in python and Matplotlib (with all the codes). source: Udemy.com
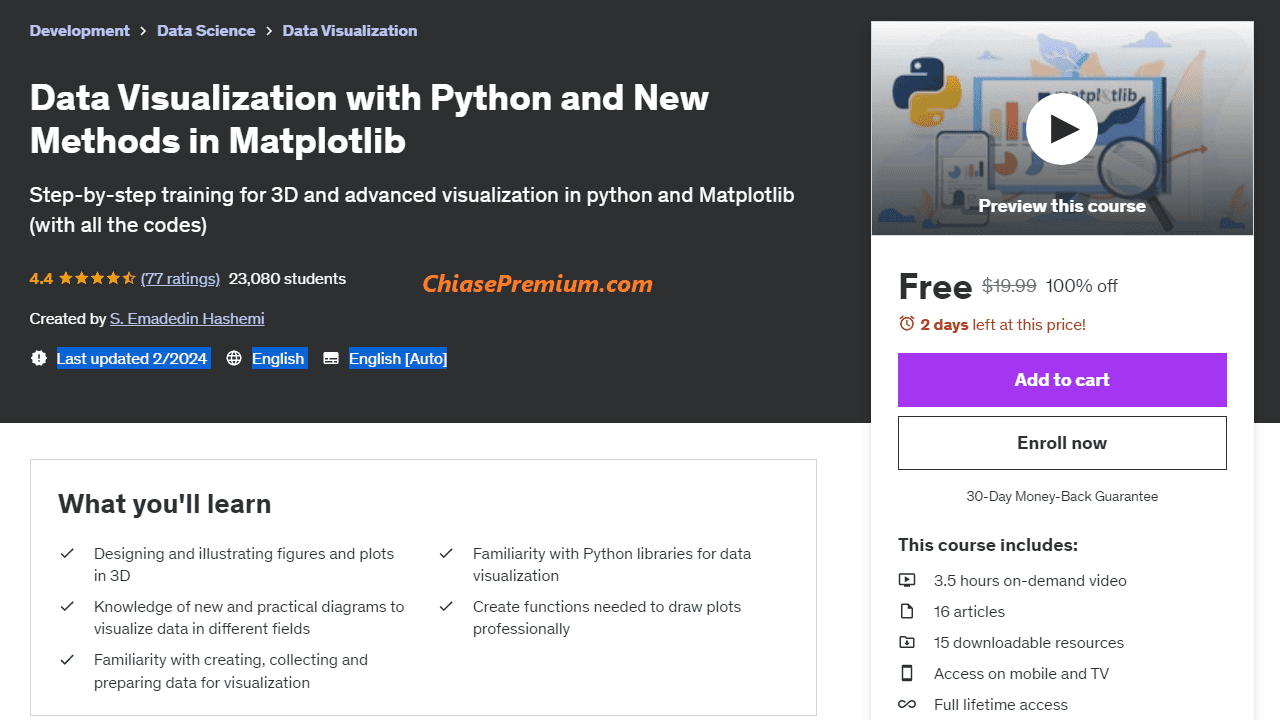
“What you’ll learn
- Designing and illustrating figures and plots in 3D
- Familiarity with Python libraries for data visualization
- Knowledge of new and practical diagrams to visualize data in different fields
- Create functions needed to draw plots professionally
- Familiarity with creating, collecting and preparing data for visualization”
source: Udemy.com
Link đăng ký miễn phí truy cập vĩnh viễn chỉ dành cho 120 đăng ký đầu tiên trong hôm nay (free only for 120 enrolls today) ngày 21.5.2024: https://www.udemy.com/course/advanced-data-visualization-with-python/?couponCode=0DCE4B0420A73F8C238E,
Excel Dashboard Reporting
Mastering Excel Data Analysis & Dashboard Reporting.
Unlocking Insights and Visualizing Trends for Informed Decision-Making. source: Udemy.com
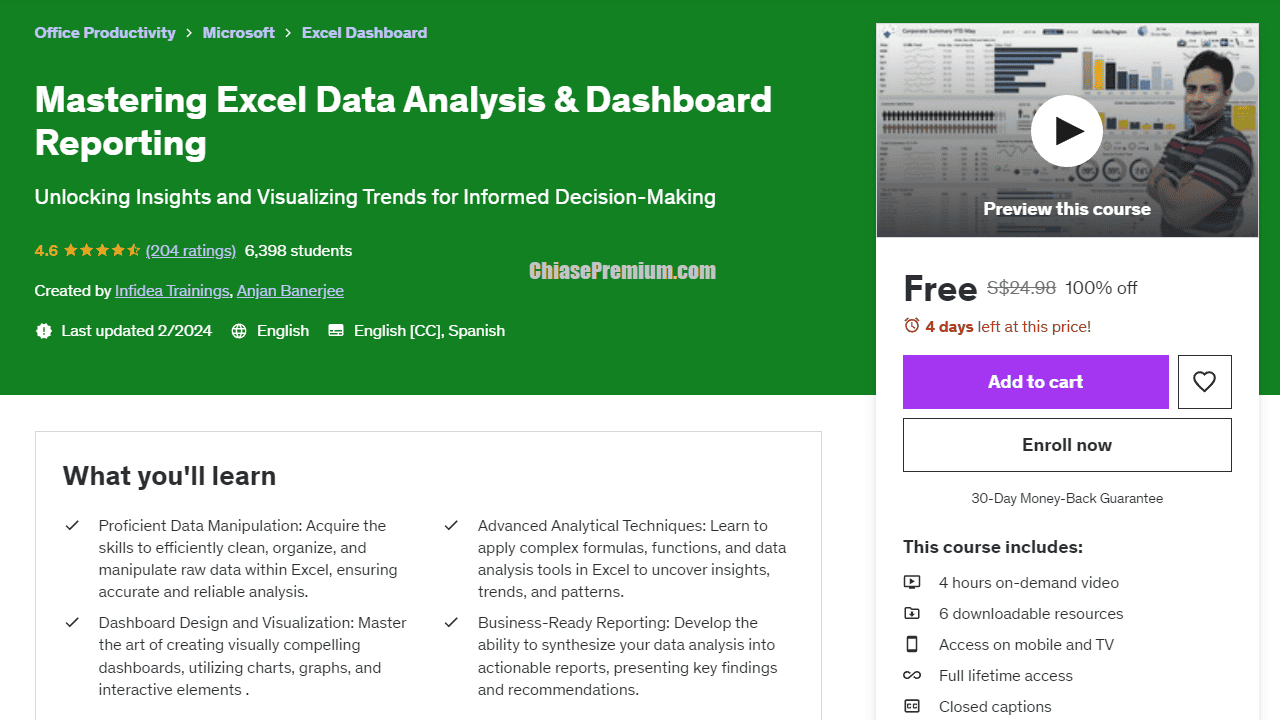
Nội dung chính của khóa học:
“Unlock the potential of Microsoft Excel with our comprehensive Excel Dashboard course. In today’s data-driven world, Excel stands out as one of the most powerful and widely-used data analysis desktop applications. Our course is designed to empower you with the skills to create dynamic and visually appealing dashboards, revolutionizing the way you present and interpret data.
An Excel dashboard serves as a centralized hub, showcasing a condensed overview of extensive data sets. Through the strategic utilization of elements such as tables, charts, and gauges, these dashboards offer an intuitive snapshot of critical information. By presenting key insights in a single window, dashboards streamline the decision-making process, enabling you to extract meaningful conclusions without drowning in raw data.
Our course delves deep into the art of crafting Excel dashboards that go beyond mere visuals. You’ll learn how to compile metrics and data points into a coherent narrative, revolutionizing the way you communicate insights. Excel dashboards offer a holistic view of essential metrics, transforming complex information into easy-to-understand charts and graphs that instantly capture attention.
From beginners seeking to enhance their Excel skills to seasoned professionals aiming to elevate their data analysis game, our course is tailored to all levels of expertise. Dive into the world of data visualization and manipulation with our hands-on modules that explore various tools, techniques, and functionalities. Whether you’re tasked with customizing reports, tracking metrics, or making informed decisions, our Excel Dashboard course equips you with the prowess to do so effortlessly.
Unleash the true potential of Excel and elevate your data analysis capabilities. Enroll now and embark on a transformative journey to master the art of creating engaging, insightful, and impactful dashboards. Your data has stories to tell – let Excel be your storyteller.
Who this course is for:
- Individuals proficient in Microsoft Excel seeking to enhance their ability to effectively analyze extensive datasets and generate dynamic dashboard reports.”
source: Udemy.com
Link đăng ký miễn phí truy cập vĩnh viễn chỉ dành cho 120 đăng ký đầu tiên trong hôm nay (free only for 120 enrolls today) ngày 18.6.2024: https://www.udemy.com/course/excel-dashboard-2023/?couponCode=252D4A3BA3E137835F14
Xem thêm:
- Cách đăng ký tài khoản Domestika Plus – nền tảng học tập cho người sáng tạo
- Cách đăng ký tài khoản DataCamp giá rẻ
- Chia sẻ cách tạo tài khoản Picsart Gold miễn phí (mới nhất)
- Review, Chia sẻ cách đăng ký khóa học, tài khoản Skillshare premium free
- 50+ khóa học Power BI miễn phí: Phân tích, trực quan hóa dữ liệu
- [Free] Khoá học Xử lý ngôn ngữ tự nhiên (NLP) miễn phí 30 giờ


