Chia sẻ các Khóa học Tableau, cơ hội tuyệt vời để khám phá và làm chủ nghệ thuật visual analytics. Với các chuyên đề từ cơ bản đến nâng cao, bạn sẽ học được cách biến dữ liệu thành thông tin đồ họa hấp dẫn và dễ hiểu. Khám phá ngay để trở thành chuyên gia Tableau và nắm bắt cơ hội nghề nghiệp mới!
Xem thêm:
- Tableau là gì? Cách thực hành sử dụng Tableau 2024
- [Full] Khóa học Power BI miễn phí: Phân tích, trực quan hóa dữ liệu
- Agile là gì? Chia sẻ khoá học quản lý dự án Agile
- Sử dụng ChatGPT tự dộng thiết kế Slide PowerPoint | Khóa học
- [Free] Khóa Học Trống Drums online – Khóa học đánh Trống miễn phí
Tableau for Beginners: Visualize and Analyze Your Data
Step into the world of data science with Tableau! Real-world data analytics exercises & datasets. Learn and apply. source: udemy.com
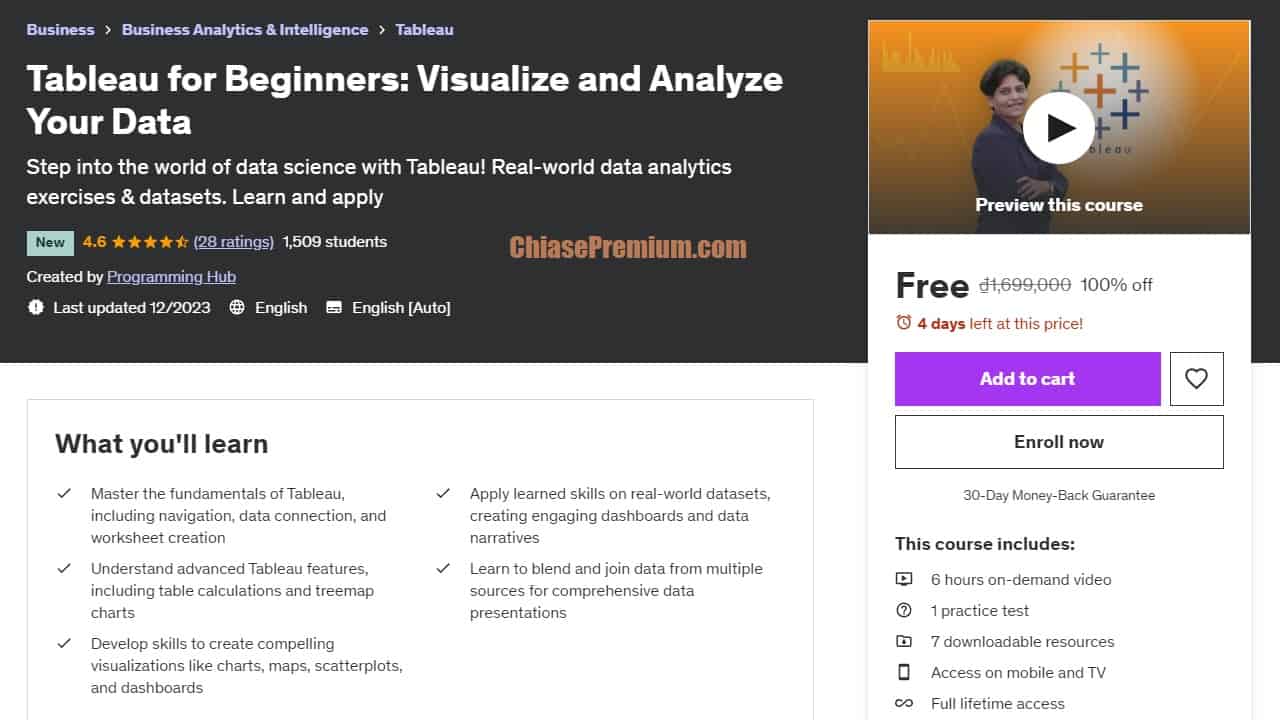
- 6 hours on-demand video
- 1 practice test
- 7 downloadable resources
- Access on mobile and TV
- Full lifetime access
- Certificate of completion
What you’ll learn
- “Master the fundamentals of Tableau, including navigation, data connection, and worksheet creation
- Apply learned skills on real-world datasets, creating engaging dashboards and data narratives
- Understand advanced Tableau features, including table calculations and treemap charts
- Learn to blend and join data from multiple sources for comprehensive data presentations
- Develop skills to create compelling visualizations like charts, maps, scatterplots, and dashboards
Requirements
- This course is entirely online, so you’ll need a computer and a stable internet connection to access the course materials and Tableau software
- No prior knowledge of data analysis or Tableau is required. All you need is curiosity and the willingness to learn and explore
Description
Welcome to “Tableau for Beginners 2023: Visualize and Analyze Your Data” – your comprehensive guide to exploring the exciting world of data science using Tableau. This course is designed to empower you with the skills to transform raw data into meaningful insights, helping you make informed decisions and tell compelling data stories.
In this course, you will:
- Get introduced to the vibrant world of Tableau, navigating the software, connecting it to various datasets, and creating your first worksheet. Absolute beginners will feel at home as we start from the basics.
- Learn to work with data extracts and time-series data, enabling you to find trends and make accurate forecasts.
- Understand the power of aggregations and granularity to summarize information and ensure precise calculations.
- Dive into data visualization, creating a variety of charts, maps, scatterplots, and interactive dashboards for each of your projects.
- Discover when and how to join or blend data, working with and presenting information from multiple sources.
- Explore the latest features of Tableau, creating table calculations, treemap charts, packed bubbles, and compelling storylines.
What sets this course apart is its hands-on approach. Each module provides a new dataset and engaging exercises that challenge you to apply what you’ve learned immediately. You’ll have access to datasets in the resources section, allowing you to practice and perfect your skills in real-world scenarios.
Moreover, you’ll have the opportunity to work on real-time projects, creating dashboards from scratch, and telling data stories that make an impact. From designing the “Power Consumption in India” dashboard to analyzing “Books My Sister Read”, you’ll gain practical experience that prepares you for the real world.
The course content is updated to stay in sync with new versions of Tableau, ensuring you stay ahead in the competitive field of data science. Whether you’re a budding data scientist or a professional looking to upskill, you’ll find this course an enriching journey.
By the end of this course, you’ll be a proficient Tableau user, ready to extract, analyze, and visualize data with ease. Whether you’re dealing with scientific data, sales trends, or customer behavior, you’ll be fully equipped to turn data into compelling narratives and insightful decisions. Embark on this exciting journey and unlock the potential of data science with Tableau!
Enroll now!
Who this course is for:
- Beginners: who have no prior experience with Tableau or data visualization, but are eager to learn and explore the world of data science
- Data Enthusiasts: who are interested in turning raw data into meaningful insights and want to add a powerful tool to their data analysis arsenal
- Career Switchers: who are looking to transition into the booming field of data science and want to gain a solid foundation in one of the industry’s leading tools
- No matter your background or profession, if you’re curious about data and want to learn how to visualize it in a meaningful way, this course is for you”
source: udemy.com
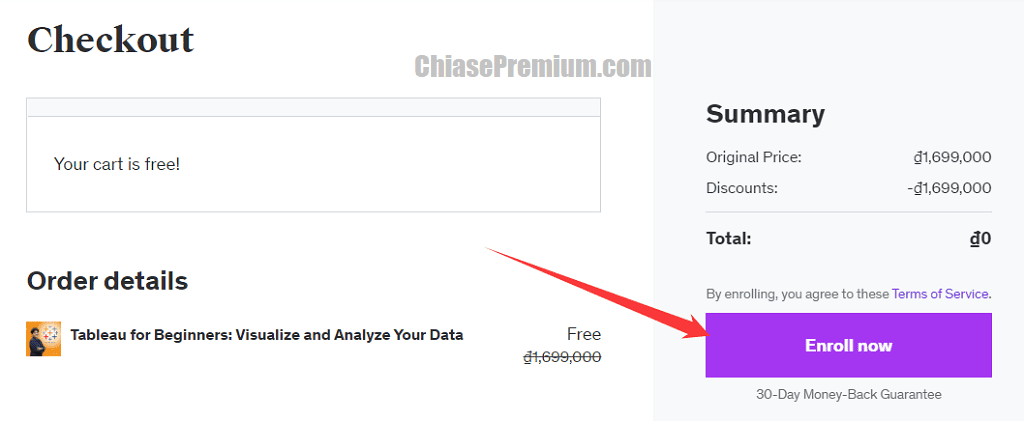
Link đăng ký miễn phí vĩnh viễn dành cho 120 đăng ký đầu tiên trong hôm nay (free for 120 enrolls today), 30/01/2024: