Chia sẻ 100+ Khóa học Power BI miễn phí và các chương trình ưu đãi đăng ký sử dụng vĩnh viễn các Khóa học Power BI miễn phí từ Udemy, Coursera,…
Nếu bạn đang muốn phát triển sự nghiệp trong ngành phân tích dữ liệu hoặc business intelligence, thì Power BI là một trong những kỹ năng quan trọng cần có trong hồ sơ việc làm của bạn. Thành thạo kỹ năng sử dụng Power BI không chỉ mang lại cho bạn nhiều cơ hội việc làm mà đây còn là một kỹ năng quý giá cần có để phát triển sự nghiệp lâu dài.
Xem thêm: Chia sẻ khóa học SAP – Top SAP Courses Online (Updated)
Power BI là gì?
Ngày nay, Data (dữ liệu) là một tài sản quý của hầu hết các doanh nghiệp. Chúng ta đã nghe nói nhiều về chuyển đổi số, nhưng một công ty/doanh nghiệp không thể chuyển đổi số thành công nếu như không có dữ liệu. Và để khai thác dữ liệu hiệu quả thì cần có những công cụ chuyên nghiệp, chẳng hạn như các phần mềm BI (Business Intelligence software)
Xem thêm: Data Visualization là gì?
Power BI là một công cụ kinh doanh thông minh (BI) cho phép bạn kết nối với nhiều nguồn dữ liệu khác nhau, tạo ra các báo cáo trực quan, có thể chia sẻ với bất kỳ ai bạn muốn. Nói chung, mục đích của BI là theo dõi các Chỉ số Đo lường Hiệu suất (KPI) và khám phá thông tin chi tiết về dữ liệu kinh doanh để cung cấp thông tin tốt hơn cho việc ra quyết định trong tổ chức của bạn.
→ Xem thêm: Khoá học Data Science 2023 (tổng hợp chia sẻ miễn phí)
Power BI là một sản phẩm ứng dụng văn phòng của nhà Microsoft, thuộc nhóm sản phẩm Business Intelligence với mục đích chính là hỗ trợ người dùng doanh nghiệp tối ưu hóa kết quả phân tích dữ liệu được thể hiện trên các báo cáo tài chính, doanh số.
Power BI xuất hiện trên thị trường vào tháng 7 năm 2011 dưới tên gọi Project Cresce. Tháng 9 năm 2013, Project Cresce đổi tên thành Power BI và sử dụng tên gọi này cho đến ngày nay.
Power BI có nhiều nét tương đồng với Excel với các tính năng như Power Query, Power Pivot và Power View. Nhưng Power BI có khả năng kết nối dữ liệu từ nhiều nguồn và tính bảo mật cao. Tháng 7 năm 2015, Power BI chính thức được Microsoft phân phối dưới dạng một sản phẩm độc lập.
Bạn có thể sử dụng Power BI trên trình duyệt web, trên máy tính và trên điện thoại thông minh. Bốn thành phần chính của Power BI là: Power BI Desktop, Power BI Apps, Power BI Service (Power BI Online) và Power BI Report Server.
Là một sản phẩm quan trọng của Microsoft, Power BI sử dụng rất ổn định, có ưu thế vượt trội so với nhiều phần mềm dịch vụ khác trong việc Xây dựng báo cáo dữ liệu (trực quan hóa dữ liệu) và tạo các dashboard doanh nghiệp. Power BI có khả năng xử lý dữ liệu lớn, cần chuyên môn cao.
Những tính năng nổi bật của Power BI:
- Truy cập dữ liệu từ nhiều khác nhau và xây dựng quy trình tự động hóa xử lý dữ liệu.
- Kết nối, chuyển đổi phân tích dữ liệu có kích thước lớn, chẳng hạn Power BI có khả năng xử lý với hàng triệu dòng dữ liệu cùng lúc.
- Trực quan hóa dữ liệu rất tốt
- Cho phép sử dụng DAX ((Data Analysis Expressions) ) để phân tích dữ liệu.
- Xây dựng nhiều mô hình phân tích dữ liệu.
Xem thêm: Data Analyst là gì? Khóa học Phân tích dữ liệu nào là tốt nhất?
Khóa học Power BI miễn phí
Có khá nhiều khóa học hướng dẫn sử dụng Power BI hiệu quả. Và hôm nay xin giới thiệu với các bạn 5 khóa học Hướng dẫn sử dụng thành thạo Power BI từ nền tảng đào tạo trực tuyến Udemy. Với các hướng dẫn chi tiết ở các khóa học dưới đây sẽ giúp bạn có thể tự học Power BI nhanh hơn.
(*) Hãy tạo một tài khoản Udemy miễn phí và nhanh tay đăng ký các khóa học rất hay về Power BI dưới đây bạn nhé. Các khóa học này đang giảm giá 100%, bạn đăng ký miễn phí và được cập nhật nội dung, sử dụng vĩnh viễn.
Xem thêm: Cách tạo tài khoản Udemy có hàng nghìn khóa học miễn phí
Khóa học Power BI miễn phí có tốt không?
Khóa học Power BI miễn phí là một lựa chọn tuyệt vời để bắt đầu học Power BI. Khóa học này cung cấp kiến thức cơ bản về cách sử dụng Power BI để truy cập, phân tích và trực quan hóa dữ liệu. Khóa học bao gồm các chủ đề như:
- Tạo báo cáo Power BI
- Sử dụng các phép đo và chỉ số
- Tạo biểu đồ và bảng
- Chia sẻ báo cáo
Khóa học Power BI miễn phí được cung cấp bởi Microsoft và có sẵn trên trang web của Microsoft. Khóa học được chia thành nhiều phần, mỗi phần bao gồm các video hướng dẫn và bài tập thực hành.
Dưới đây là một số ưu điểm của khóa học Power BI miễn phí:
- Miễn phí: Khóa học này hoàn toàn miễn phí, vì vậy bạn có thể học mà không phải lo lắng về chi phí.
- Dễ tiếp cận: Khóa học được cung cấp trực tuyến, vì vậy bạn có thể học bất cứ lúc nào và ở bất cứ đâu.
- Nội dung chất lượng: Khóa học được cung cấp bởi Microsoft, vì vậy bạn có thể yên tâm về chất lượng của nội dung.
Tuy nhiên, khóa học Power BI miễn phí cũng có một số hạn chế:
- Kiến thức cơ bản: Khóa học chỉ cung cấp kiến thức cơ bản về Power BI. Nếu bạn muốn học nâng cao hơn, bạn sẽ cần tham gia các khóa học trả phí hoặc tự học.
- Không có hỗ trợ trực tiếp: Khóa học không cung cấp hỗ trợ trực tiếp từ giảng viên hoặc trợ giảng. Nếu bạn gặp khó khăn trong quá trình học, bạn sẽ phải tự tìm cách giải quyết.
Nhìn chung, khóa học Power BI miễn phí là một lựa chọn tốt để bắt đầu học Power BI. Khóa học này cung cấp kiến thức cơ bản về cách sử dụng Power BI, giúp bạn có thể bắt đầu sử dụng Power BI ngay lập tức.
Dưới đây là một số mẹo để học tốt khóa học Power BI miễn phí:
- Xem video hướng dẫn nhiều lần: Đừng chỉ xem video một lần rồi bỏ qua. Hãy xem video nhiều lần để đảm bảo bạn hiểu rõ các khái niệm.
- Làm bài tập thực hành: Bài tập thực hành là một cách tuyệt vời để củng cố kiến thức của bạn. Hãy dành thời gian để làm bài tập thực hành sau khi xem mỗi video.
- Tham gia cộng đồng Power BI: Có rất nhiều cộng đồng Power BI trên mạng. Tham gia cộng đồng này để hỏi câu hỏi và nhận trợ giúp từ những người khác.
Có nên học Power BI
Power BI là một công cụ phân tích dữ liệu mạnh mẽ và dễ sử dụng, được sử dụng bởi các doanh nghiệp và tổ chức trên toàn thế giới. Có rất nhiều lý do để học Power BI, bao gồm:
- Tăng cường khả năng phân tích dữ liệu của bạn: Power BI cung cấp một loạt các tính năng và công cụ giúp bạn dễ dàng thu thập, phân tích và trực quan hóa dữ liệu. Với Power BI, bạn có thể nhanh chóng tìm ra thông tin chi tiết và xu hướng từ dữ liệu của mình, điều này có thể giúp bạn đưa ra quyết định kinh doanh sáng suốt hơn.
- Tăng cơ hội nghề nghiệp của bạn: Kỹ năng phân tích dữ liệu đang trở nên ngày càng quan trọng trong thị trường việc làm. Bằng cách học Power BI, bạn có thể trang bị cho mình những kỹ năng cần thiết để thành công trong một lĩnh vực đang phát triển nhanh chóng.
- Tự động hóa các tác vụ lặp đi lặp lại: Power BI có thể giúp bạn tự động hóa các tác vụ lặp đi lặp lại, chẳng hạn như thu thập dữ liệu, tạo báo cáo và phân tích dữ liệu. Điều này có thể giúp bạn tiết kiệm thời gian và tập trung vào các nhiệm vụ quan trọng hơn.
- Tạo các báo cáo và dashboard trực quan: Power BI cung cấp một loạt các công cụ trực quan hóa dữ liệu, giúp bạn tạo ra các báo cáo và dashboard hấp dẫn và dễ hiểu. Điều này có thể giúp bạn chia sẻ thông tin chi tiết với các đồng nghiệp và lãnh đạo một cách hiệu quả hơn.
Dưới đây là một số lợi ích cụ thể của việc học Power BI:
- Khả năng kết nối với nhiều nguồn dữ liệu: Power BI có thể kết nối với nhiều nguồn dữ liệu khác nhau, bao gồm cơ sở dữ liệu, bảng tính, tệp CSV và API. Điều này cho phép bạn phân tích dữ liệu từ nhiều nguồn khác nhau để có được cái nhìn toàn diện hơn về doanh nghiệp của bạn.
- Khả năng tạo các báo cáo và dashboard tương tác: Power BI cho phép bạn tạo các báo cáo và dashboard tương tác, cho phép người dùng khám phá dữ liệu theo cách họ muốn. Điều này có thể giúp bạn chia sẻ thông tin chi tiết một cách hiệu quả hơn và khuyến khích người dùng tham gia vào quá trình phân tích dữ liệu.
- Khả năng tích hợp với các ứng dụng khác của Microsoft: Power BI có thể tích hợp với các ứng dụng khác của Microsoft, chẳng hạn như Excel, PowerPoint và SharePoint. Điều này cho phép bạn chia sẻ thông tin chi tiết của mình với các ứng dụng và người dùng khác một cách dễ dàng.
Nếu bạn quan tâm đến việc học Power BI, có rất nhiều tài nguyên có sẵn để bạn sử dụng. Microsoft cung cấp một loạt các tài liệu đào tạo và hướng dẫn, cũng như các khóa học trực tuyến và ngoại tuyến. Bạn cũng có thể tìm thấy nhiều cộng đồng và diễn đàn Power BI trực tuyến nơi bạn có thể tìm kiếm sự giúp đỡ và lời khuyên từ các chuyên gia khác.
Dưới đây là một số tài nguyên để bạn bắt đầu học Power BI:
- Tài liệu đào tạo của Microsoft: Microsoft cung cấp một loạt các tài liệu đào tạo Power BI, bao gồm hướng dẫn, bài tập và video.
- Các khóa học trực tuyến: Có rất nhiều khóa học trực tuyến Power BI có sẵn, từ các khóa học cơ bản đến các khóa học nâng cao.
- Các khóa học ngoại tuyến: Có rất nhiều trung tâm đào tạo cung cấp các khóa học Power BI ngoại tuyến.
- Cộng đồng và diễn đàn Power BI: Có rất nhiều cộng đồng và diễn đàn Power BI trực tuyến nơi bạn có thể tìm kiếm sự giúp đỡ và lời khuyên từ các chuyên gia khác.
Khóa học Power BI cơ bản
Khóa học Power BI cơ bản thường bao gồm các nội dung sau:
- Giới thiệu về Power BI
- Khái niệm Power BI
- Lợi ích của Power BI
- Cấu trúc của Power BI
- Cách cài đặt Power BI
- Lập mô hình dữ liệu
- Kết nối với các nguồn dữ liệu
- Tạo tập dữ liệu
- Tạo bảng
- Tạo mối quan hệ giữa các bảng
- Trực quan hóa dữ liệu
- Tạo biểu đồ
- Tạo đồ thị
- Tạo bản đồ
- Tạo thước đo và chỉ báo
- Phân tích dữ liệu
- Tạo các câu hỏi dữ liệu
- Sử dụng các công cụ phân tích
- Tìm hiểu xu hướng và mối quan hệ
- Chia sẻ và phân phối
- Xuất báo cáo và dashboard
- Chia sẻ báo cáo và dashboard
Ngoài ra, một số khóa học Power BI cơ bản còn bao gồm các nội dung nâng cao hơn, chẳng hạn như:
- Tạo các báo cáo phân trang
- Tạo các báo cáo tương tác
- Tạo các báo cáo tự động
- Tích hợp Power BI với các ứng dụng khác
Khóa học Power BI cơ bản phù hợp với những người mới bắt đầu học về Power BI. Khóa học sẽ cung cấp cho học viên những kiến thức và kỹ năng cơ bản để sử dụng Power BI để phân tích dữ liệu.
Khóa học Power BI nâng cao
Khóa học Power BI nâng cao bao gồm các nội dung sau:
- Kiến thức nền tảng về Power BI
- Tổng quan về Power BI
- Mô hình dữ liệu trong Power BI
- Trực quan hóa dữ liệu trong Power BI
- Xây dựng báo cáo trong Power BI
- Chia sẻ và phân phối báo cáo trong Power BI
- Nội dung nâng cao
- Xử lý dữ liệu nâng cao trong Power BI
- Phân tích dữ liệu nâng cao trong Power BI
- Tạo báo cáo chuyên sâu trong Power BI
- Chia sẻ và phân phối báo cáo nâng cao trong Power BI
Xử lý dữ liệu nâng cao trong Power BI
- Sử dụng Power Query để xử lý dữ liệu nâng cao
- Tìm hiểu về đặc tính dữ liệu
- Xử lý dữ liệu Text, Number, Date
- Xử lý dữ liệu thiếu sót
- Các bài toán xử lý dữ liệu nâng cao
- Sử dụng DAX để xử lý dữ liệu nâng cao
- Khái niệm cơ bản về DAX
- Các hàm DAX nâng cao
- Tạo các chỉ số và thước đo nâng cao
Phân tích dữ liệu nâng cao trong Power BI
- Sử dụng các visual nâng cao trong Power BI
- Visual phân tích chuỗi thời gian
- Visual phân tích địa lý
- Visual phân tích phân nhóm
- Visual phân tích phân tích
- Sử dụng các tính năng nâng cao của Power BI
- Power BI Q&A
- Power BI Embedded
- Power BI Report Server
Tạo báo cáo chuyên sâu trong Power BI
- Thiết kế báo cáo chuyên sâu
- Sử dụng các nguyên tắc thiết kế báo cáo
- Tạo các báo cáo theo yêu cầu của người dùng
- Tạo báo cáo tự động
- Sử dụng các tính năng tự động hóa trong Power BI
- Tạo các báo cáo tự động cập nhật
Chia sẻ và phân phối báo cáo nâng cao trong Power BI
- Chia sẻ báo cáo với người dùng bên ngoài
- Sử dụng Power BI Pro
- Sử dụng Power BI Premium
- Phân phối báo cáo cho nhiều người dùng
- Sử dụng Power BI Report Server
- Sử dụng Power BI Embedded
Khóa học Power BI nâng cao phù hợp với những người đã có kiến thức nền tảng về Power BI và muốn nâng cao kỹ năng sử dụng Power BI. Khóa học giúp học viên nắm vững các kiến thức và kỹ năng nâng cao trong Power BI, từ đó có thể tạo ra các báo cáo phân tích dữ liệu chuyên sâu và hiệu quả.
Dưới đây là một số lợi ích khi tham gia khóa học Power BI nâng cao:
- Nâng cao kiến thức và kỹ năng sử dụng Power BI
- Tạo ra các báo cáo phân tích dữ liệu chuyên sâu và hiệu quả
- Nâng cao cơ hội thăng tiến trong công việc
- Tự tin ứng tuyển vào các vị trí phân tích dữ liệu
Hy vọng những thông tin trên sẽ giúp bạn hiểu rõ hơn về khóa học Power BI nâng cao.
Chia sẻ khóa học Power BI miễn phí vĩnh viễn, cập nhật liên tục: Dưới đây mình sẽ chia sẻ link đăng ký miễn phí (thường dành cho 120 đăng ký đầu tiên) một số khóa học Power BI vĩnh viễn.
Become an SQL BI Developer
Become an SQL BI Developer – SSRS, Power BI, SQL Server, ETL. Master SQL BI Developer Tools: SSRS, Power BI, SQL Server, ETL. Source: Udemy.com
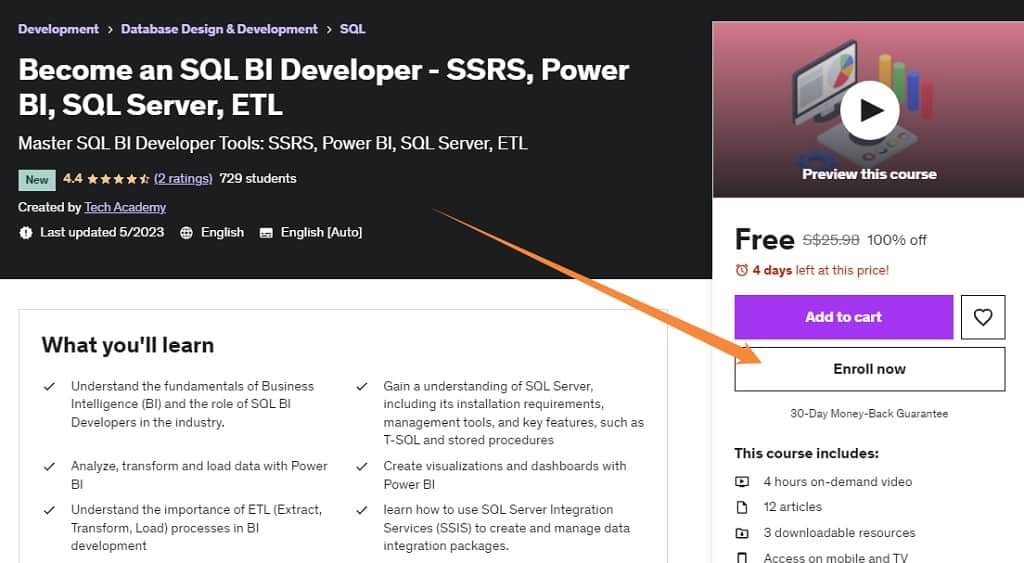
4 hours on-demand video
12 articles
3 downloadable resources
Access on mobile and TV
Full lifetime access
- “Understand the fundamentals of Business Intelligence (BI) and the role of SQL BI Developers in the industry.
- Gain a understanding of SQL Server, including its installation requirements, management tools, and key features, such as T-SQL and stored procedures
- Analyze, transform and load data with Power BI
- Create visualizations and dashboards with Power BI
- Understand the importance of ETL (Extract, Transform, Load) processes in BI development
- learn how to use SQL Server Integration Services (SSIS) to create and manage data integration packages.
- Learn best practices for error handling, performance optimization, and ETL process management in SSIS.
- Acquire the skills necessary to excel in the competitive field of BI development, enabling you to create data-driven solutions that drive business growth and em” Source: Udemy.com
Link đăng ký miễn phí vĩnh viễn, 20.5.2023, dành cho 120 đăng ký đầu tiên (free for only 120 enrolls today): https://www.udemy.com/course/become-an-sql-bi-developer-ssrs-power-bi-sql-server-etl/?couponCode=A332E348AF71216BBB9A
Microsoft PowerBI Masterclass 2023
Microsoft PowerBI Masterclass Edition (Latest Version Sep’23). Become a Microsoft PowerBI Developer & rise in the Data & Analytics World with the most valuable data skill right now. Source: Udemy.com
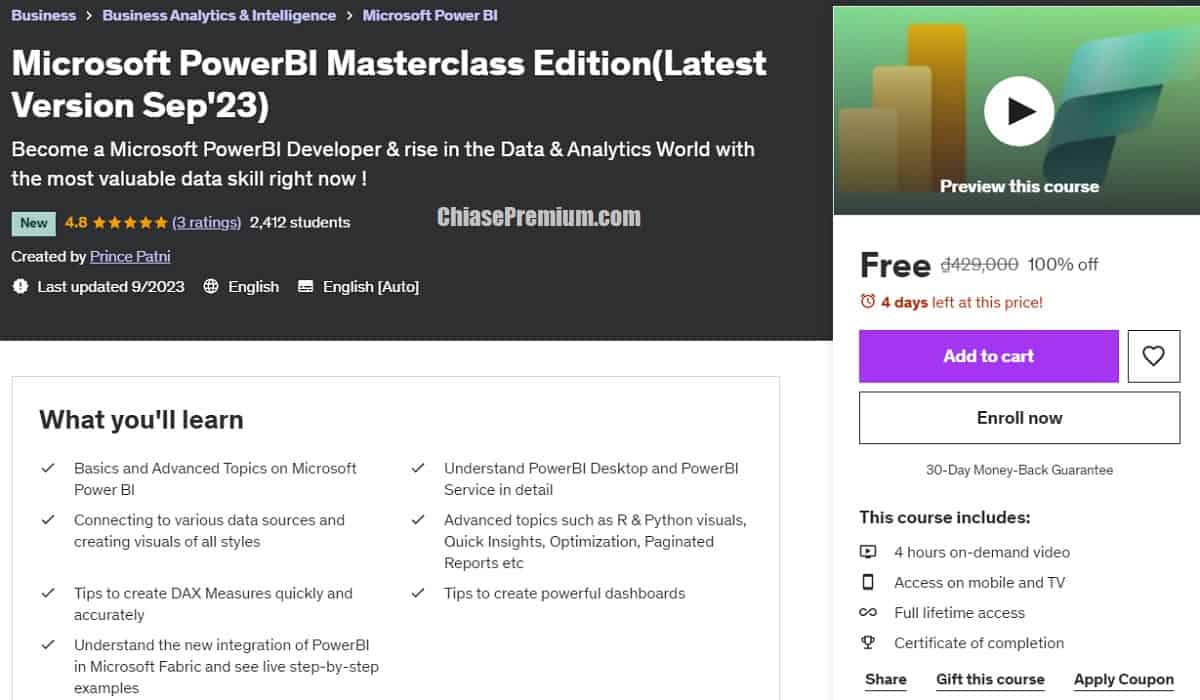
- “4 hours on-demand video
- Access on mobile and TV
- Full lifetime access
- Certificate of completion
What you’ll learn
- Basics and Advanced Topics on Microsoft Power BI
- Understand PowerBI Desktop and PowerBI Service in detail
- Connecting to various data sources and creating visuals of all styles
- Advanced topics such as R & Python visuals, Quick Insights, Optimization, Paginated Reports etc
- Tips to create DAX Measures quickly and accurately
- Tips to create powerful dashboards
- Understand the new integration of PowerBI in Microsoft Fabric and see live step-by-step examples”
Link đăng ký miễn phí vĩnh viễn dành cho 120 đăng ký đầu tiên trong hôm nay (free for 120 enrolls today), 31/10/2023: https://www.udemy.com/course/microsoft-powerbi-masterclass-latest-version/?&couponCode=OCT-NOV

Learn Microsoft Power BI in Microsoft Fabric – 2 in 1 Course. Microsoft Fabric is the future of Data Analytics and Business Intelligence and the best time to start learning is now. Link đăng ký miễn phí cho 120 đăng ký đầu tiên, cập nhật 31/10/2023: https://www.udemy.com/course/learn-microsoft-power-bi-in-microsoft-fabric-2-in-1-course/?&couponCode=OCT-NOV
AI-Driven Data Storytelling with PowerBI 2023
Communicate powerful insights from data. Source: udemy.com
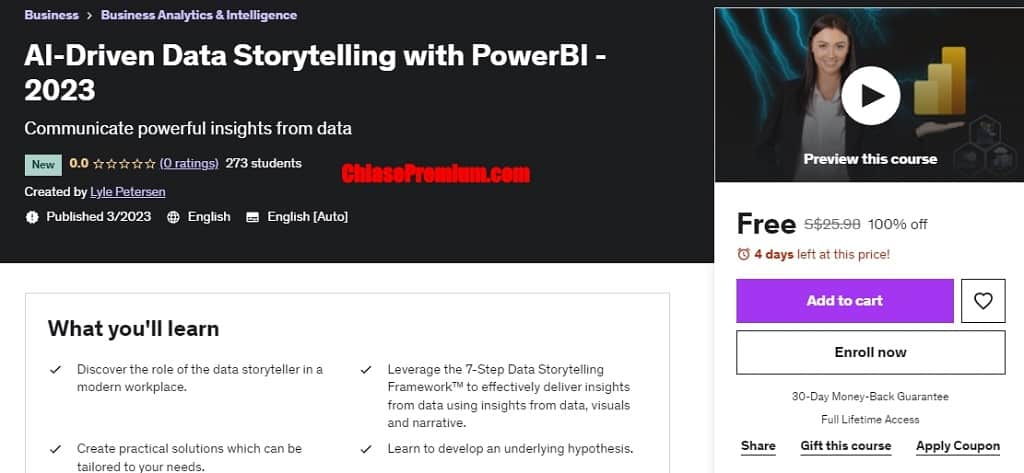
“Data storytelling is developing as an essential skill in the modern workplace and one of the main means of delivering insights from analytics. In this course we will explore data storytelling to extract, understand and effectively communicate insights in a compelling manner. The goal is positive business outcomes, strategic insights and improved team collaboration.
Stories have historically been the tool of leaders and influencers – simplifying the world around us, uniting communities and making a lasting impact. Your favorite series, brands, marketers and leaders use stories to build engagement and to communicate key values and insights. Similarly in the complex world of data – stories combining data visuals and key insights – cut through the clutter – engage with logic and emotion and drive actionable outcomes. Data storytelling is a powerful means to share insights and drive change within an organization.
In this course we will use the 7-step data storytelling framework™ to find the value in data and tailor it to the needs of stakeholders using visuals and a compelling narrative. This is a simple step-by-step framework to delve into data – find those underlying questions and communicate an actionable outcome.” source: udemy.com
Link đăng ký miễn phí vĩnh viễn dành cho 120 đăng ký đầu tiên trong hôm nay (free for 120 enrolls today): https://www.udemy.com/course/ai-driven-data-storytelling-with-powerbi-2023/?couponCode=03113545AD22D4DBF444
Microsoft Power BI Advanced Dashboard
Full Practical Course
We will help you learn how to create Clean DASHOARDS (2023 Edition) Advanced Power BI analysis & data visualization. source: udemy.com
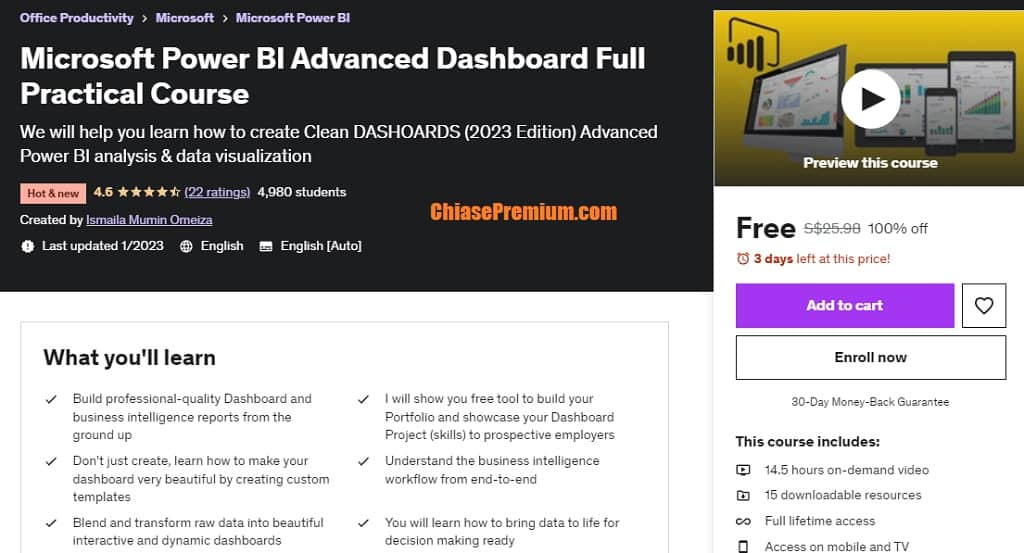
14.5 hours on-demand video
15 downloadable resources
Free | Full lifetime access (for 120 enrolls today)
What you’ll learn
- “Build professional-quality Dashboard and business intelligence reports from the ground up
I will show you free tool to build your Portfolio and showcase your Dashboard Project (skills) to prospective employers - Don’t just create, learn how to make your dashboard very beautiful by creating custom templates
- Understand the business intelligence workflow from end-to-end
- Blend and transform raw data into beautiful interactive and dynamic dashboards
- You will learn how to bring data to life for decision making ready” source: udemy.com
Link đăng ký miễn phí vĩnh (120 enrolls today, 2/2/2023): https://www.udemy.com/course/microsoft-power-bi-advanced-dashboard-full-practical-course/?couponCode=7A4A5E3CF294D26664B7
Learn Power BI Basics
In this tutorial you will be learning all basic knowledge required for Power BI and understanding Power BI component. Source: udemy.com
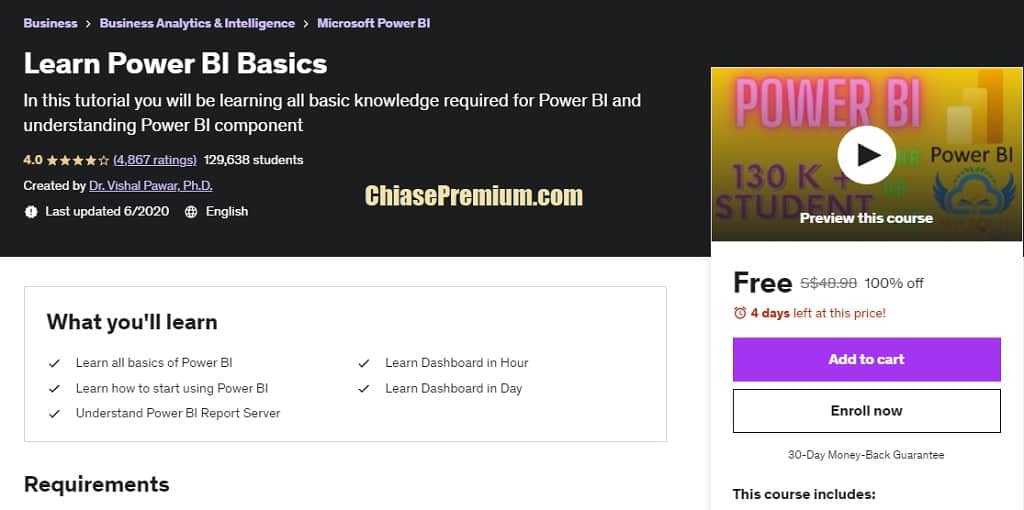
- Description
“As Data is the new electricity, Power BI is a new factual Powerpoint to view your mirror of business. Power BI Provides end-to-end data analytics, Business Intelligence, Stunning visualization, and rich reporting pillar for your organization.
Power BI transforms your company’s data into rich visuals for you to collect and organize so you can focus on what matters to you. Stay in the know, spot trends as they happen, and push your business further.
Are you looking for new ways to find and visualize data and share discoveries? Power BI can help. This collection of tools, online services, and features from Microsoft transforms your company’s data into rich visuals for you to collect and organize, so you can spot trends, collaborate in new ways, and make sense of your data.
This video tutorial contains the following chapter decks
- Power BI Dashboard in Hour (1 Hr)
- Power BI Dashboard in Day (4 Hr)
- Power BI Basics (1 Hr)
- Power BI Report Server In Details (1 Hr)
It takes 5 seconds to lose focus on using technology to make it work. Your Onboarding (not HR or Job) cohesive convergence with technology sets its path to destine to maneuver technology.
You learn on your own first, and Then you share experiences to gain interest and teach. But what if we share our universal expertise with you so you can explore the possibilities of exploding technology in your organization and especially to you.” source: udemy.com
Link đăng ký miễn phí vĩnh viễn (120 enroll today, 18/1/2023): https://www.udemy.com/course/learn_power_bi_for_free/?couponCode=PBIFREEFIRST300
Financial Reporting w/Power BI
(Bestseller) Create comprehensive financial reports in Power BI that represent key insights in a compelling and dynamic way.
Một số nội dung chính của khóa học:
- Hướng dẫn tạo các báo cáo tài chính bằng công cụ Power BI.
- Tìm hiểu cách tối ưu hóa & lập mô hình dữ liệu báo cáo tài chính với Power BI
- Trực quan hóa các chỉ số tài chính
- Cách kết hợp các chức năng DAX cho báo cáo của bạn
- Tạo báo cáo tài chính chi tiết hoàn toàn tự động
- Tìm hiểu cách quản lý dữ liệu từ nhiều bảng trong một mô hình.
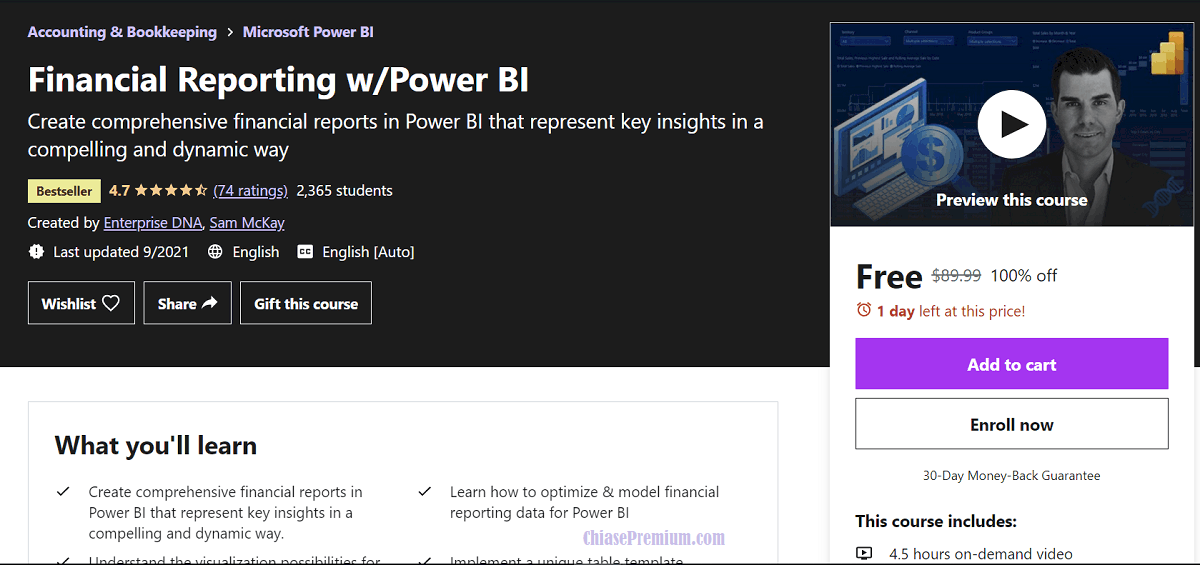
Link đăng ký khóa học miễn phí và sử dụng vĩnh viễn:
Power BI Super Users Workshop
An in depth overview of the entire Power BI suite, with a focus on using Power BI to extract compelling insights
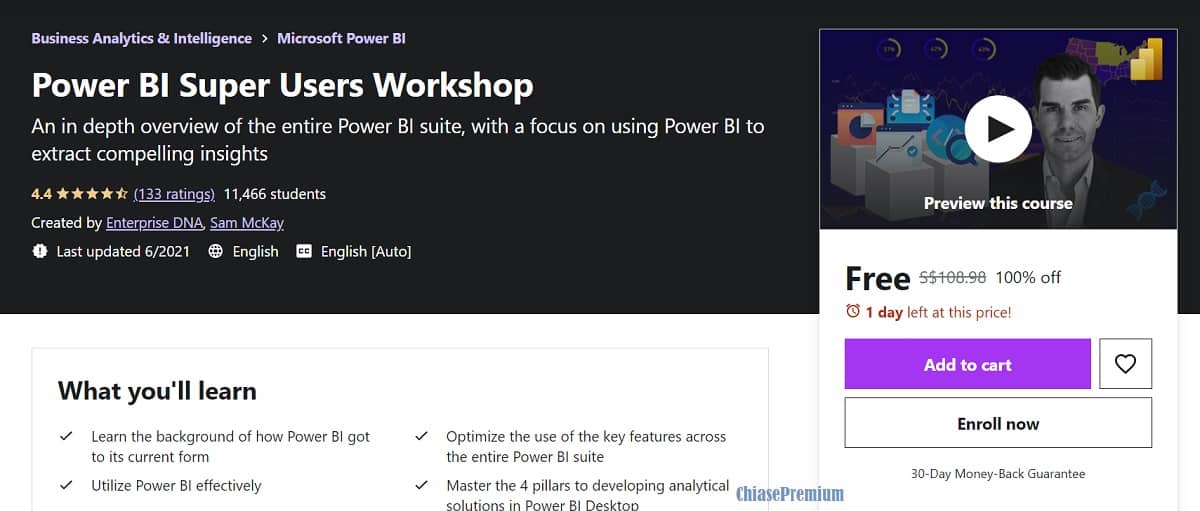
Một số nội dung chính của khóa học:
- Tìm hiểu chi tiết về Power BI
- Sử dụng thành thạo các chức năng chính của Power BI
- Cách sử dụng Power BI một cách hiệu quả
- Nắm vững 4 trụ cột để phát triển các giải pháp phân tích trong Power BI Desktop
- Thực hành tải và chuyển đổi dữ liệu, lập mô hình dữ liệu, tính toán DAX & phát triển báo cáo
- Xây dựng mô hình phân tích dữ liệu.
- Sử dụng các công thức DAX và các kỹ thuật DAX tối ưu kết quả báo cáo dữ liệu
- Xây dựng các báo cáo dữ liệu trực quan và hấp dẫn.
- Tìm hiểu các thủ thuật sử dụng Power BI hiệu quả
Link đăng ký khóa học:
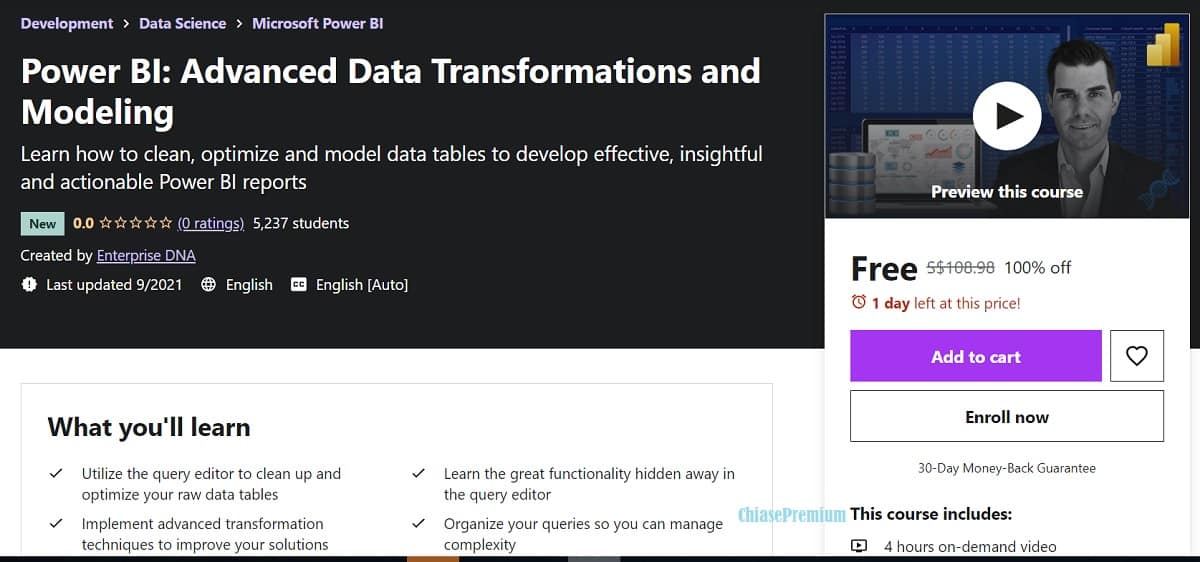
Advanced Data Transformations
Power BI: Advanced Data Transformations and Modeling. Learn how to clean, optimize and model data tables to develop effective, insightful and actionable Power BI reports. Source: Udemy.com
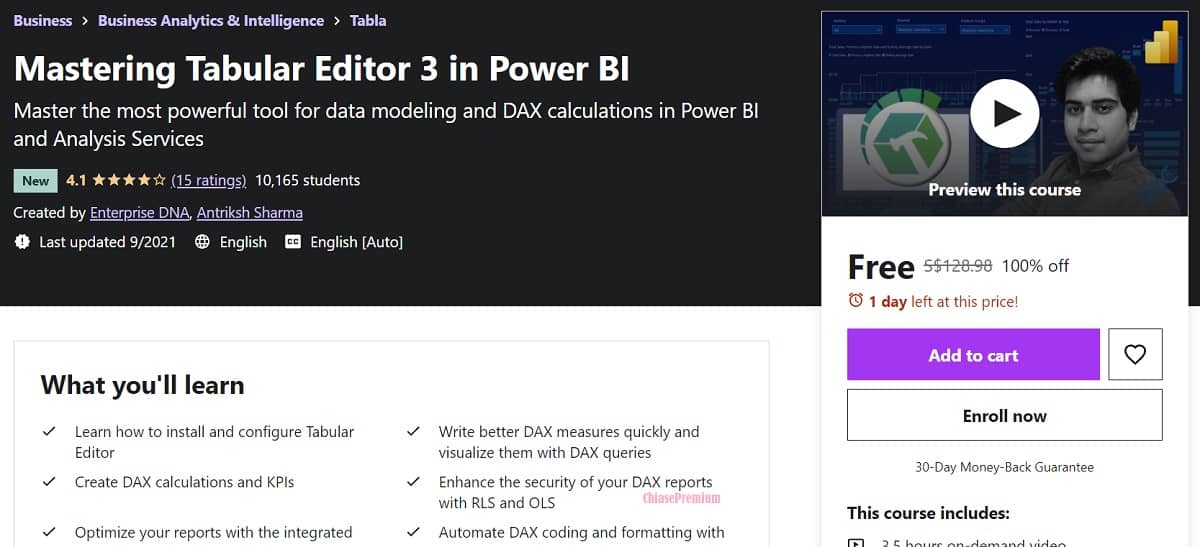
Mastering Tabular Editor 3 in Power BI
Master the most powerful tool for data modeling and DAX calculations in Power BI and Analysis Services
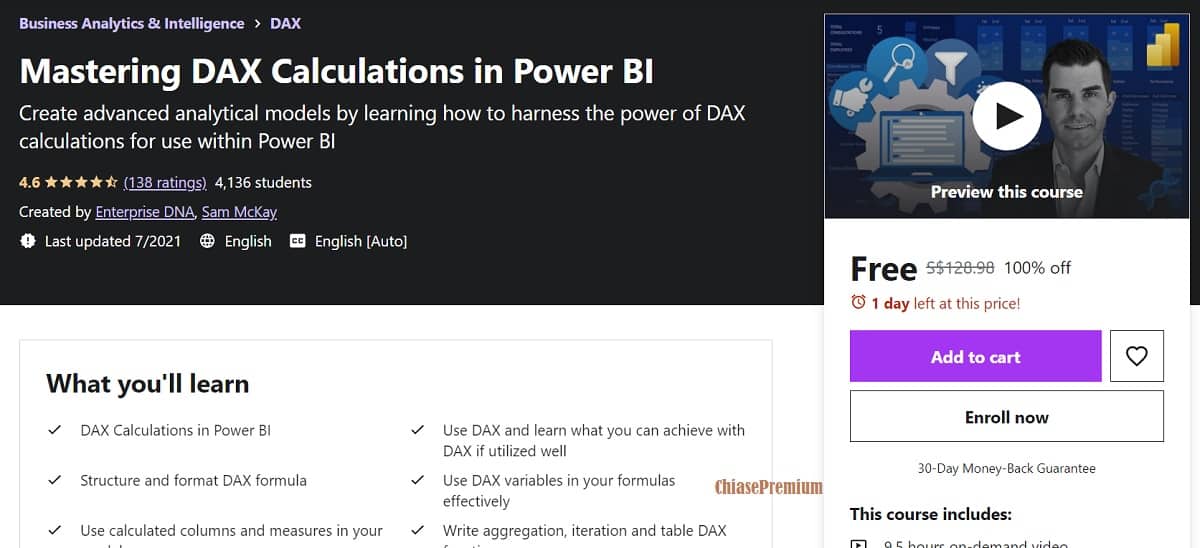
Mastering DAX Calculations in Power BI
Create advanced analytical models by learning how to harness the power of DAX calculations for use within Power BI
Xem thêm: Hướng dẫn tạo tài khoản Udemy với hàng nghìn khóa học cập nhật và sử dụng vĩnh viễn
Cập nhật 23/11/2021:
Chia sẻ link đăng ký miễn phí khóa học:
Power BI & Business Intelligence 2021
Curso Power BI: Cuadros de mando, dashboards, modelado y análisis de datos, gráficos, informes, reportes, KPIs, y DAX” (Source: Udemy.com)
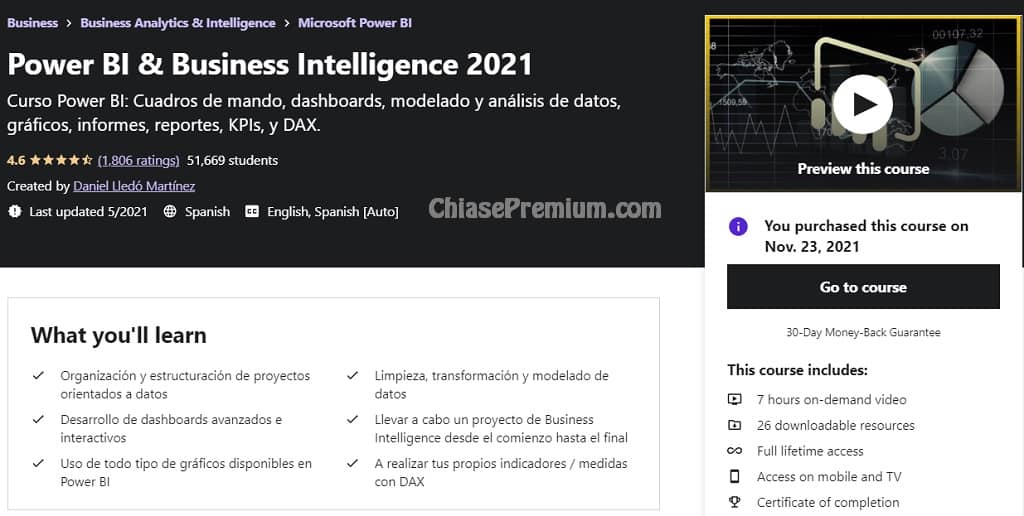
- Link đăng ký miễn phí và sử dụng vĩnh viễn (áp dụng cho 1000 người đăng ký đầu tiên): https://www.udemy.com/course/power-bi-para-business-inteligence-de-0-a-100/?couponCode=BLACK_FRIDAY_POWERBI
- Chú ý: khóa học này giảng dạy bằng tiếng Tây Bạn Nha, có phụ đề tiếng Anh.
Cập nhật 12/3/2022:
Chia sẻ link đăng ký khóa học:
Essentials of Power BI
Get Started with Data Analysis .Learn fundamentals, creating project from scratch and follow along”. (Source: Udemy.com)

-
3.5 hours on-demand video
-
1 article
-
Full lifetime access
Link đăng ký miễn phí (1000 slots):
Cập nhật 3.5.2022
Chia sẻ link đăng ký khóa học:
Microsoft Power BI PL-300 EXAM
Advanced Practice Exams 2022. Attend this Microsoft PL-300 Practice Certification Exam will get a Great Score 90% on Main Exam”
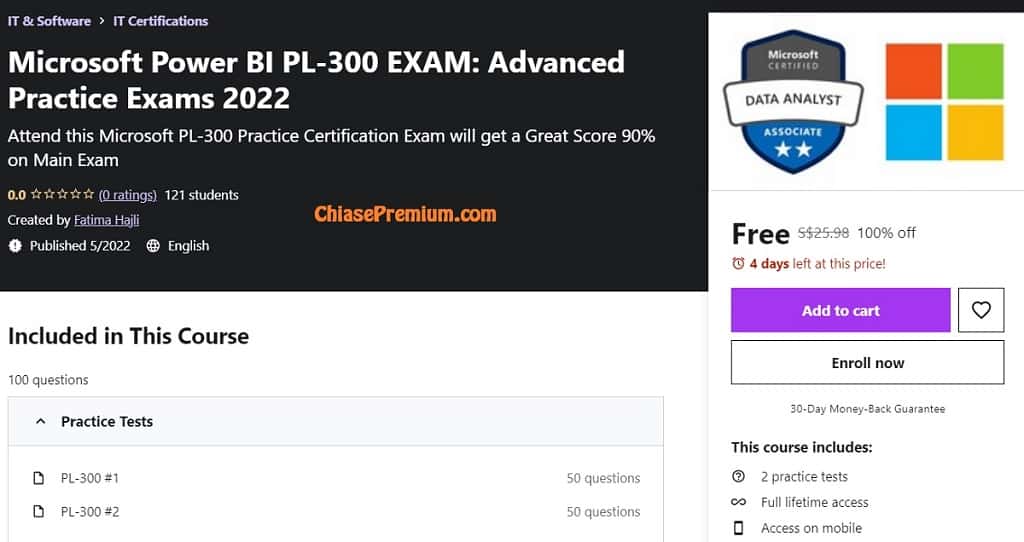
Link đăng ký miễn phí (1000 slots): https://www.udemy.com/course/microsoft-power-bi-pl-300-exam-advanced-practice-exams-2022/?couponCode=FIRSTPROMO
Cập nhật 11.5.2022
Master Microsoft Power BI in 21 Days
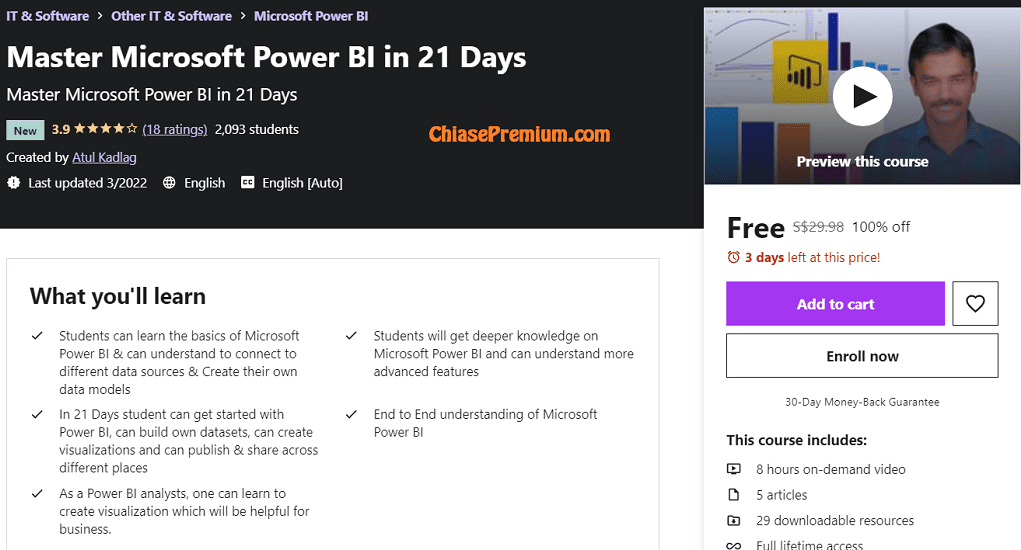
“What you’ll learn
- Students can learn the basics of Microsoft Power BI & can understand to connect to different data sources & Create their own data models
- Students will get deeper knowledge on Microsoft Power BI and can understand more advanced features
- In 21 Days student can get started with Power BI, can build own datasets, can create visualizations and can publish & share across different places
- End to End understanding of Microsoft Power BI
- As a Power BI analysts, one can learn to create visualization which will be helpful for business.
Description
If you want to learn Microsoft Power BI from the basics if you want to improve your analytical skills which have vast demand in the market.
Following are the topics you are going to learn from in this course.
- What is Power BI?
- What technology or toolset is needed to learn Power BI?
- Why do we need Power BI?
- Different components in the Power BI area.
- What is Power BI Desktop? How to start using it? How to create the projects in Power BI Desktop?
- How to connect to a different database in Power BI Desktop?
- Understand Query Editor and how to use it?
- How to create Data Model? How to create relationships?
- Understand different relationship types, Cardinality and join Kinds with Practical example
- How to create your First Visuals?
- What are different visuals you can create, what are different formatting capabilities that can be used to make the most of the visuals?
- Learn about Microsoft Power BI service?
- How to Move your local project created in Power BI Desktop to Cloud?
- How to create different dashboards? How to publish it.
- How to share and collaborate your applications with other users.
- Explore all aspects of Microsoft Power BI Pro service.
- What is DAX? DAX vs M-Language
- Which one to use? DAX or M-Language
- Implement DAX formula and M-language practically
- What is Power BI Mobile?
- How to set up Power BI Mobile? How to access different reports/dashboards in Power BI Mobile?
- What are Custom Visuals and what’s it used?
- Tools and technologies needed to create Custom visuals?
- How to bind real data with Custom visuals.
- all these with theory and practical examples.”
Source: udemy.com
Cập nhật link đăng ký miễn phí 22.7.2022
https://www.udemy.com/course/master-microsoft-power-bi-in-21-days/?couponCode=FREECOURSEFORALL
Microsoft Power BI 2022
Master Power BI within few hours & Be Ready to jump into the field of Analytics
![Microsoft Power BI: A Complete Guide [2022 Edition]](https://chiasepremium.com/wp-content/uploads/images21/Pasted-100.png)
- 8 hours on-demand video
- 3 articles
- Full lifetime access
- Access on mobile and TV
Source: udemy.com
Link đăng ký miễn phí (1000 slots, 17.5.2022)
https://www.udemy.com/course/microsoft-power-bi-complete-guide-2022-edition/?couponCode=FREEMAY
Chia sẻ link đăng ký truy cập vĩnh viễn khóa học:
Microsoft Power BI The Complete Guide
A comprehensive guide on how to master Power BI. Take a hands-on approach with a Formula One Course Project. Source: udemy.com
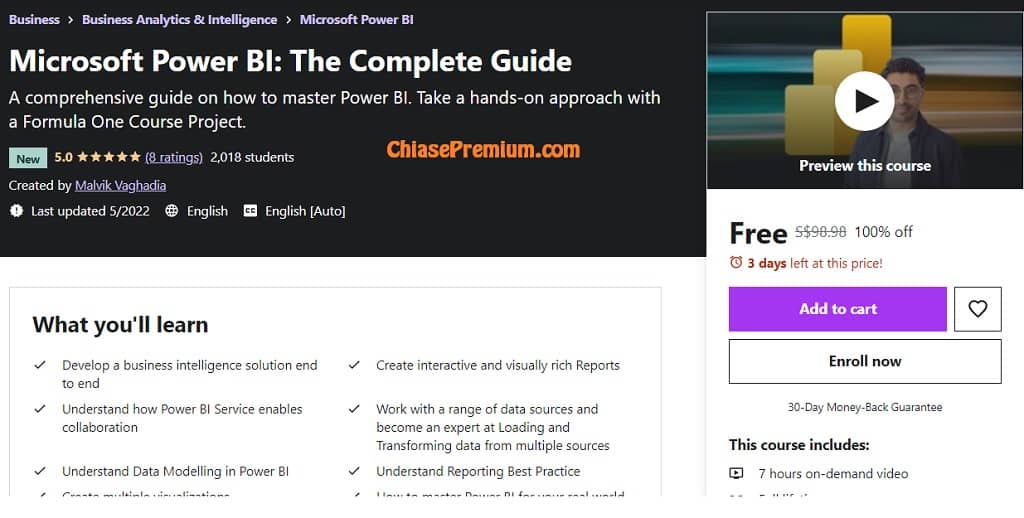
- 7 hours on-demand video
- Free| Full lifetime access
- Certificate of completion. Source: udemy.com
Nội dung chính:
- Phát triển một giải pháp kinh doanh thông minh từ đầu đến cuối
- Cách tạo Báo cáo tương tác và trực quan phong phú
- Hiểu cách cộng tác khi sử dụng Power BI
- Làm việc với nhiều nguồn dữ liệu và Chuyển đổi dữ liệu từ nhiều nguồn với Power BI
- Mô hình hóa dữ liệu trong Power BI
- Xây dựng báo cáo thực tế với Power BI
- Tạo nhiều trực quan hóa dữ liệu với Power BI
- Làm thế nào để thành thạo Power BI với các dự án thực tế
Tìm hiểu một trong những công cụ kinh doanh thông minh được ưa chuộn nhất hiện nay trên thế giới và nắm vững các khái niệm quan trọng nhất trong Hệ sinh thái Power BI.
Power BI là một công cụ cần thiết cho bất kỳ ai làm việc với Dữ liệu!
- Power BI cho phép kết nối với nhiều nguồn dữ liệu khác nhau bao gồm csv, excel, JSON và hơn thế nữa.
- Power BI giúp bạn thực hiện các chuyển đổi dữ liệu.
- Sử dụng các mối quan hệ và phương pháp lập mô hình dữ liệu để tạo ra một mô hình dữ liệu hiệu quả.
- Khám phá tất cả các loại hình ảnh trực quan từ Biểu đồ cột, Biểu đồ phân tán, Bản đồ, Chú giải công cụ và hơn thế nữa.
- Sử dụng Phần tử trực quan như biểu tượng hành động và nút để điều hướng giữa các trang trong báo cáo.
- Khám phá các tính năng của Power BI Pro và cách mà công cụ có thể cho phép bạn cộng tác trong Tổ chức/Nhóm của mình
- Sử dụng Biểu thức phân tích dữ liệu để thêm thông tin phân tích chi tiết vào trong Báo cáo Power BI.
Link đăng ký miễn phí (cho 200 người đăng ký đầu tiên, cập nhật 10.9.2022): https://www.udemy.com/course/microsoft-power-bi-the-complete-guide/?couponCode=34C8DDEBCDC58F54F6D8
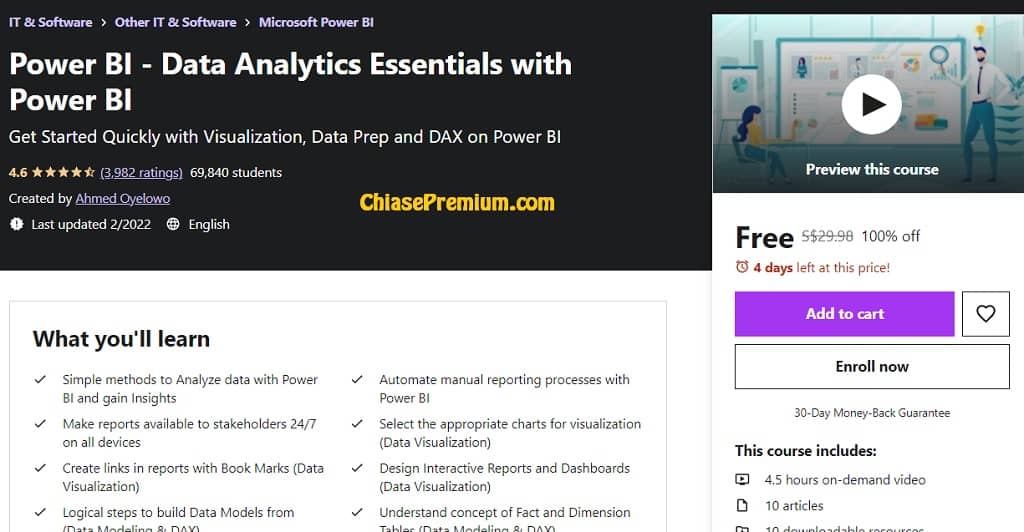
Data Analytics Essentials with Power BI
Get Started Quickly with Visualization, Data Prep and DAX on Power BI
Source: udemy.com
“What you’ll learn
- Simple methods to Analyze data with Power BI and gain Insights
- Automate manual reporting processes with Power BI
- Make reports available to stakeholders 24/7 on all devices
- Select the appropriate charts for visualization (Data Visualization)
- Create links in reports with Book Marks (Data Visualization)
- Design Interactive Reports and Dashboards (Data Visualization)
- Logical steps to build Data Models from (Data Modeling & DAX)
- Understand concept of Fact and Dimension Tables (Data Modeling & DAX)
- Simplified methods to write your own DAX Measures (Data Modeling & DAX)
- Build your Calendar/Date Table from Scratch with DAX (Data Modeling & DAX)
- Combine multiple Excel Workbooks (Data Preparation)
- Combine Multiple Excel Worksheets (Data Preparation)
- Master the rules for Data Preparation (Data Preparation)”
Source: udemy.com
Power BI Interview
Questions and Answers. Source: Udemy.com
Cập nhật đăng ký miễn phí vĩnh viễn 13.6.2022
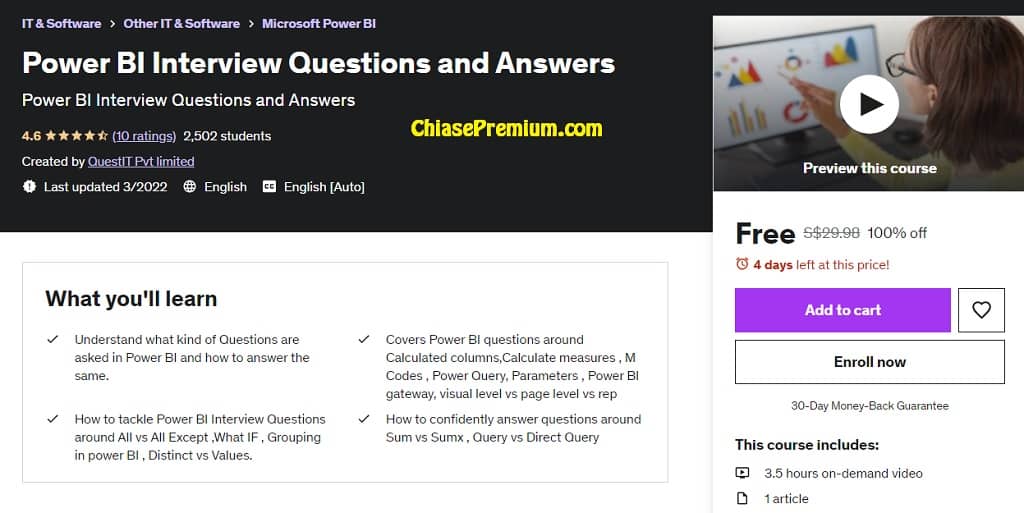
Free | Full lifetime access
3.5 hours on-demand video
1 article
1 downloadable resource
✅ What you’ll learn
– [ ] Understand what kind of Questions are asked in Power BI and how to answer the same.
– [ ] Covers Power BI questions around Calculated columns, Calculate measures , M Codes , Power Query, Parameters , Power BI gateway, visual level vs page level vs rep
– [ ] How to tackle Power BI Interview Questions around All vs All Except ,What IF , Grouping in power BI , Distinct vs Values.
– [ ] How to confidently answer questions around Sum vs Sumx , Query vs Direct Query
(Source: Udemy.com)
Link đăng ký miễn phí (cho 1000 người đăng ký đầu tiên): https://www.udemy.com/course/power-bi-interview-questions-and-answers-c/?couponCode=POWER-BIINTERVIEWQNA
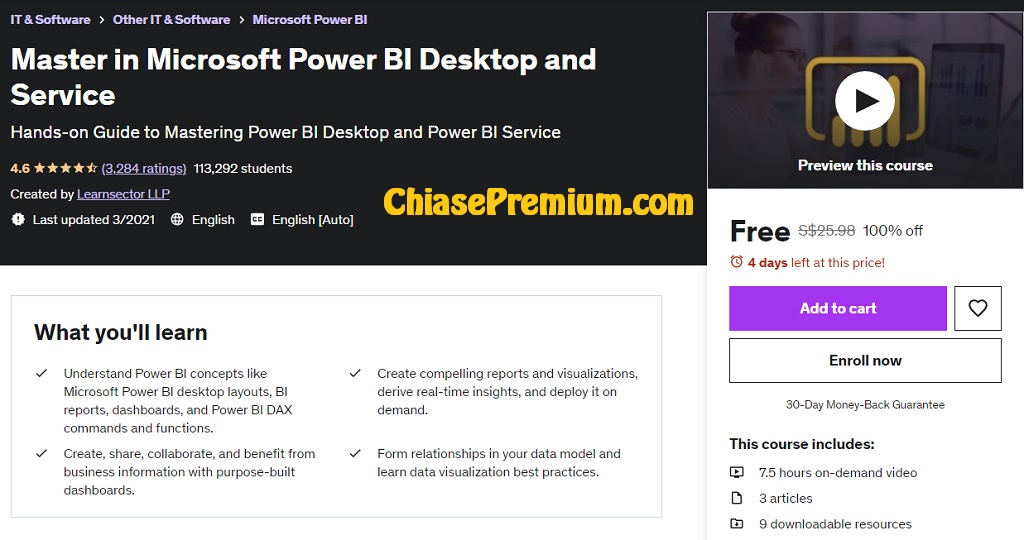
Master in Microsoft Power BI
Master in Microsoft Power BI Desktop and Service. Hands-on Guide to Mastering Power BI Desktop and Power BI Service. Source: Udemy.com
“What you’ll learn:
- Understand Power BI concepts like Microsoft Power BI desktop layouts, BI reports, dashboards, and Power BI DAX commands and functions.
- Create compelling reports and visualizations, derive real-time insights, and deploy it on demand.
- Create, share, collaborate, and benefit from business information with purpose-built dashboards.
- Form relationships in your data model and learn data visualization best practices.”
Source: udemy.com
Link đăng ký miễn phí (cập nhật 3/3/2023, dành cho 120 đăng ký đầu tiên):
https://www.udemy.com/course/power-bi-master-course/?couponCode=1C1FDE7BEBFDF3BE1212
Microsoft Power BI DAX from Scratch
Hands-on guide to Microsoft Power BI DAX.
Source: udemy.com
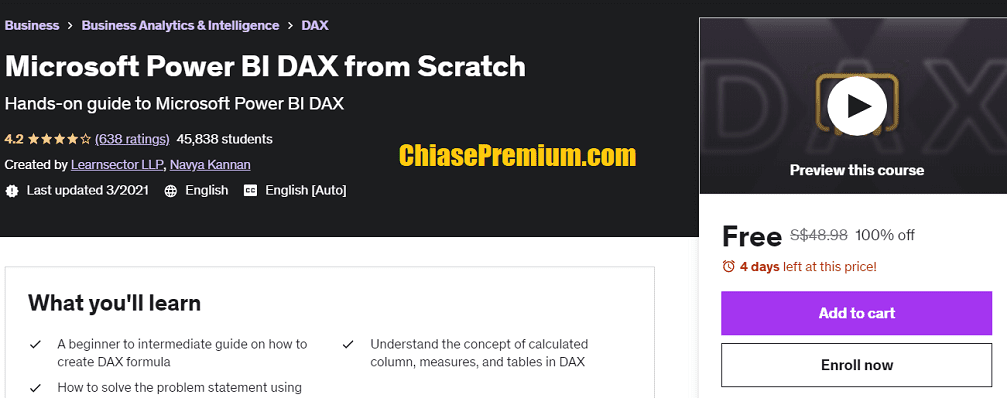
3 hours on-demand video
9 downloadable resources
Free | Full lifetime access
Access on mobile and TV
➤What you’ll learn:
- “A beginner to intermediate guide on how to create DAX formula
- Understand the concept of calculated column, measures, and tables in DAX
- How to solve the problem statement using various DAX function
DAX or Data Analysis Expression is a library of functions and operators, using which you can create formulas and expressions. This will help you with creating powerful formulas to ease your data analysis and reporting process.
This course is designed in a Problem Statement – Solution format where we start with the problem to which a solution is sought with the help of DAX functions where each component of the expression is clearly explained in easy-to-understand terms,
In this course, you will
1. Understand the concept of DAX and how to create calculate column, measure, tables, and quick measures
2. From the exhaustive list of DAX functions, we will be looking into the most frequently used functions from the family of
Date and Time function – WEEKDAY, EDATE, EOMONTH, DATEDIFF, TODAY, NOW
Text function – FORMAT, COMBINEVALUES, LEFT, RIGHT, FIND, UPPER, LOWER, UNICHAR, REPT
Logical function – IF, Nested IF, AND, OR, SWITCH
Relationship function – RELATED, CROSSFILTER, RELATEDTABLE
X-function – SUMX, RANKX
Filter function – CALCULATE, ALL, EARLIER, FILTER, LOOKUPVALUE
Statistical function – DISTINCTCOUNT
Time intelligence function- DATESYTD, DATEADD, SAMEPERIODLASTYEAR
Information function- CONTAINS
Table manipulation function- SUMMARIZECOLUMNS.”
(Source: Udemy)
→ Link đăng ký miễn phí vĩnh viễn (áp dụng cho 150 đăng ký đầu tiên, cập nhật 3/3/2023), nếu bạn cần hãy nhanh tay đăng ký trước ưu đãi miễn phí này hết hạn nhé: https://www.udemy.com/course/microsoft-power-bi-dax-foundation-from-scratch/?couponCode=A2D5B8C6C19A79D2805A
POWER BI Data Analytics and DASHBOARDS
POWER BI data Analytics Course and DASHBOARDS creation 2022.
Power BI Dashboard Advanced Example, Better ways to create Advanced Power BI Visualization and impress your Boss, Now.
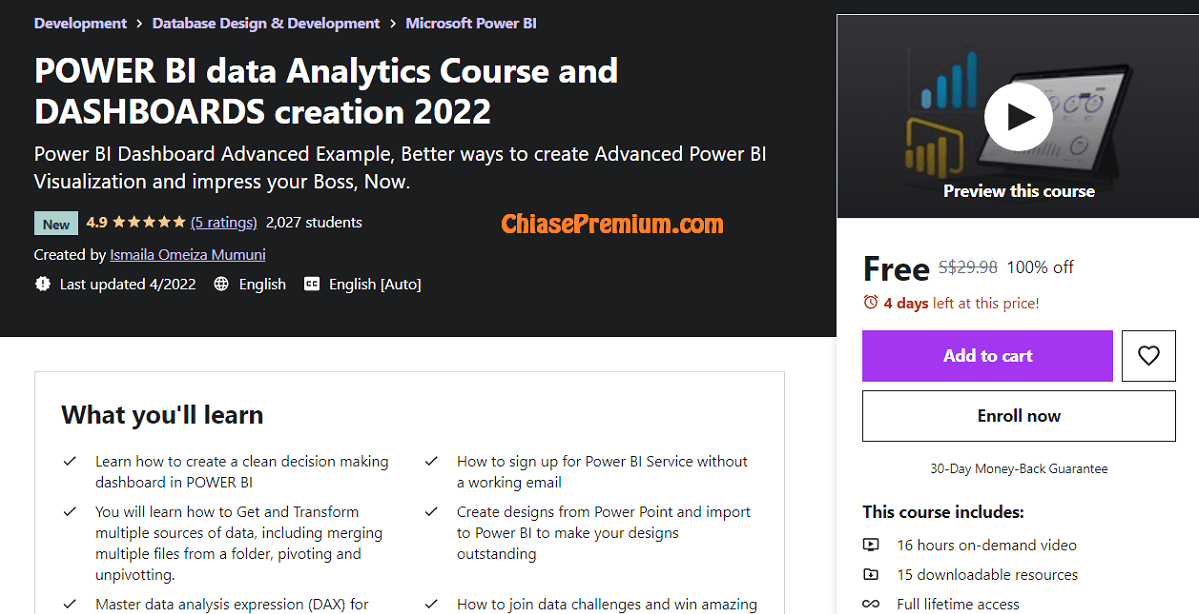
- 16 hours on-demand video
- 15 downloadable resources
- Full lifetime access
- Access on mobile and TV
- Certificate of completion
What you’ll learn
- Learn how to create a clean decision making dashboard in POWER BI
- How to sign up for Power BI Service without a working email
- You will learn how to Get and Transform multiple sources of data, including merging multiple files from a folder, pivoting and unpivotting.
- Create designs from Power Point and import to Power BI to make your designs outstanding
- Master data analysis expression (DAX) for Power BI Desktop and build better dashboards
- How to join data challenges and win amazing prices
“This course is 100% practical with real-life data to understand how to approach projects, and what to do to achieve the aims of your clients or your boss in the office.
You might be good at writing DAX in POWER BI but not always cool with the end results of either your reports or dashboards, I am going to say that is why I am here. I am here to help you with DAX, data cleaning, and transformation using POWER QUERY.
My dashboards look stunning and outstanding because I use an external tool called POWERPOINT to create beautiful background temples. In this course, I am going to teach you how to use PowerPoint to create a background template for your dashboards and import it to POWER BI.
I went through some POWER BI dashboards challenges I had taken part in and won some.
As soon as you complete this course, you can apply for a Power BI job with no fear. Take part in data challenges and show them what you got.
Are you ready now? If you are, sign up for the course.
Who this course is for:
- Beginners, intermediary, and advanced Power BI users
- For analyst who wants to get a lot better at dashboard creation
- For someone who wants to work as freelancer and help businesses from HOME
- No prior experience in reporting tools or DAX function is required.
- This course may not be for you if you have no interest for data analytics skills”
Xem thêm: Khóa học Data Analysis, Data Analytics miễn phí (Full)
Source: udemy
Link đăng ký miễn phí vĩnh viễn, 15/6/2022:
Microsoft Power BI Practice Tests
Microsoft Power BI Practice Tests and Interview QuestionsTest & Improve your Microsoft Power BI skills | All topics included | Practice Questions | Common Interview Questions. Source: udemy.com
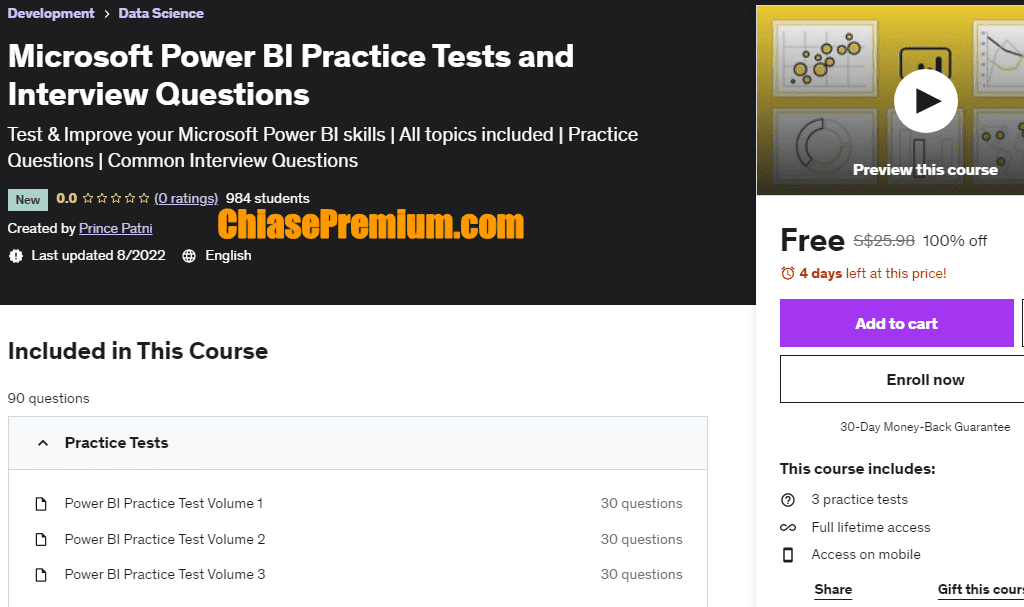
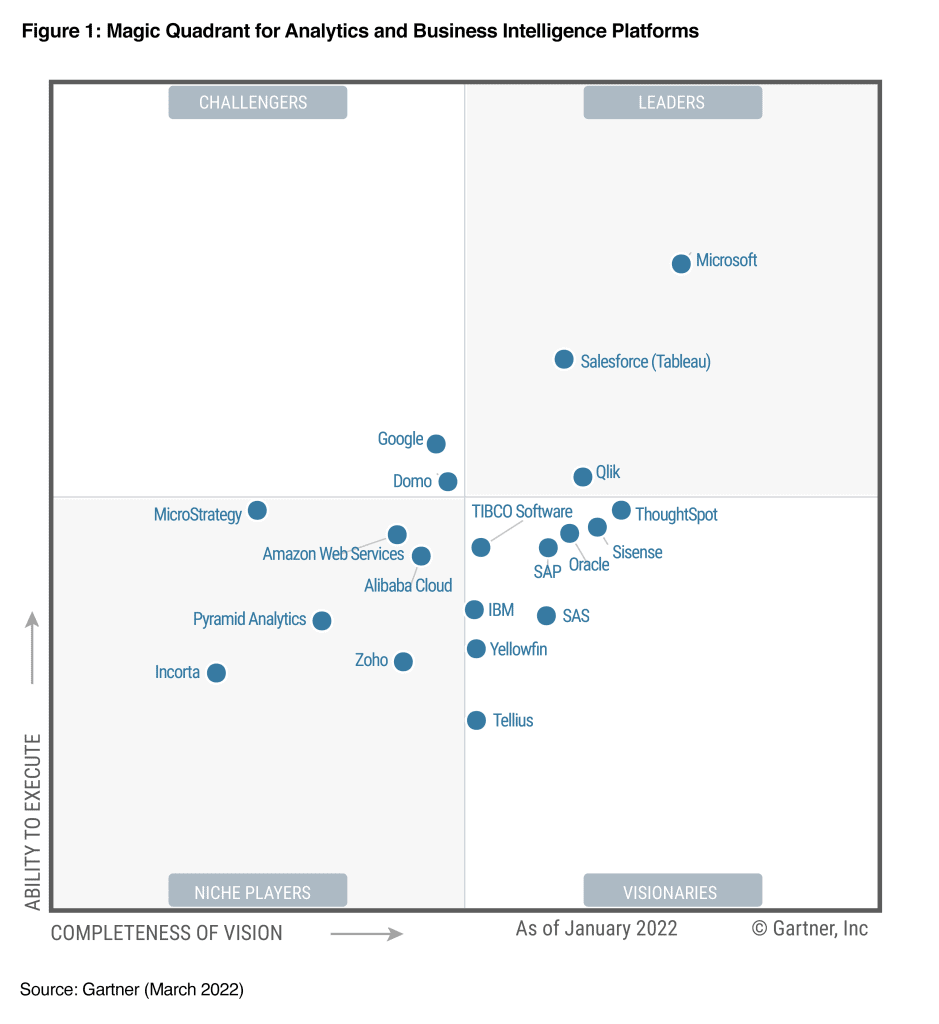
Microsoft’s Power BI analyzes and visualizes raw data to give actionable insights. Business analytics, data visualization, and best practices enable companies make data-driven choices. Gartner named Microsoft Leader in the “2019 Gartner Magic Quadrant for Analytics and Business Intelligence Platform” in February 2019 due to Power BI’s features.
Why is Power BI popular and essential in BI?
- Multiple-source data access
- UI/UX interactivity
- Excel Integration Excellence
- Azure speeds Big Data prep
- Action-oriented insights
- Streaming analytics
Power BI desktop app creates reports, Power BI Services (SaaS) publishes them, and Power BI mobile app views them.
This course includes:
- It has 3 practice tests.
- The 30-minute, 30-question practice exam has a 50% passing rate.
- Multiple-choice questions.
- Test responses are randomized.
- Questions are easy to hard.
- After the exam, you’ll obtain a strength-to-weakness report.
- You can retake tests as needed.
- You can practice with new questions without repurchasing the course.
- Learning Resources and latest updates/news/events/knowledge will be emailed to all enrolled students.
This course includes 100 frequently-updated Power BI interview and practice questions for a lifetime. After the test, you’ll be more confident in these areas and able to effortlessly conduct simple and sophisticated activities while working on any project, whether it dashboard building or power query creation. These techniques work in all areas and scenarios. You’ll also be able to pass Power BI Certification Exams and job interviews. source: udemy.com
Link đăng ký miễn phí vĩnh viễn (only 200 enrolls today, 30/1/1023):
Mastering Microsoft Power BI
From Beginner to Advanced. Unlocking the Secrets of Data Visualization and Transforming Insights into Action. Source: Udemy.com
(Free)
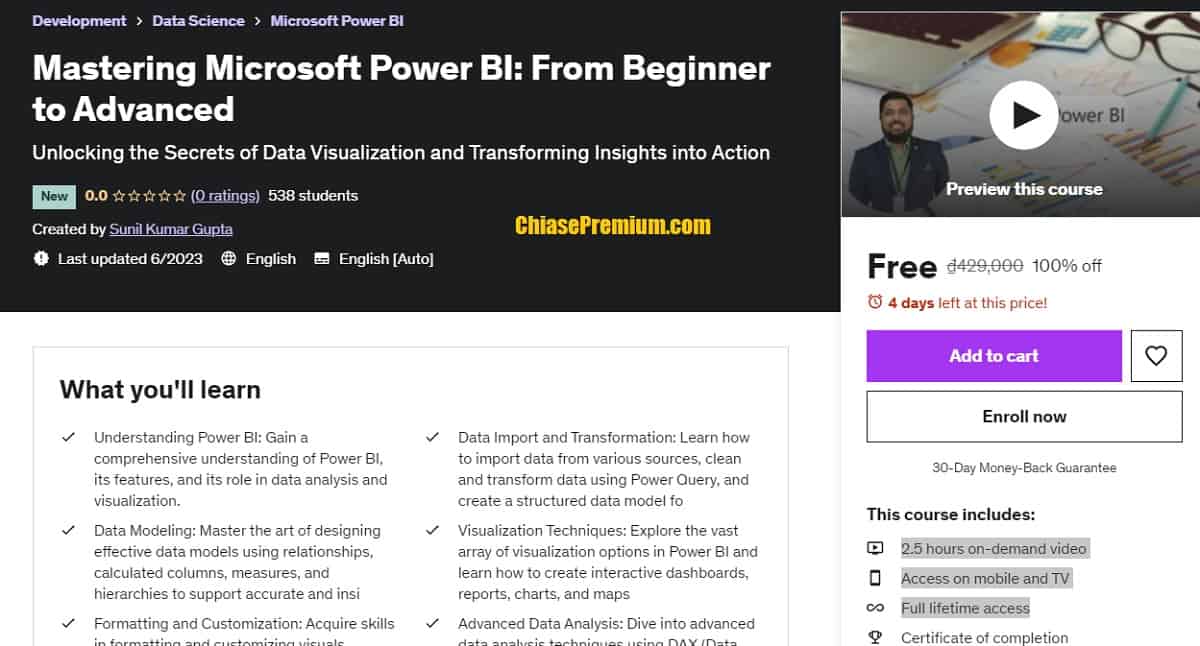
2.5 hours on-demand video
Access on mobile and TV
Full lifetime access
- “Understanding Power BI: Gain a comprehensive understanding of Power BI, its features, and its role in data analysis and visualization.
- Data Import and Transformation: Learn how to import data from various sources, clean and transform data using Power Query, and create a structured data model fo
- Data Modeling: Master the art of designing effective data models using relationships, calculated columns, measures, and hierarchies to support accurate and insi
- Visualization Techniques: Explore the vast array of visualization options in Power BI and learn how to create interactive dashboards, reports, charts, and maps
- Formatting and Customization: Acquire skills in formatting and customizing visuals, applying themes, and utilizing interactive features like drill-through to en
- Advanced Data Analysis: Dive into advanced data analysis techniques using DAX (Data Analysis Expressions) to write complex formulas, create calculated measures,
- Power Query Transformations: Learn advanced data transformation techniques using Power Query to handle complex data structures, merge queries, and perform data
- Data Insights with AI: Explore Power BI’s AI capabilities and learn how to leverage machine learning algorithms, statistical functions, and forecasting techniqu
- Collaboration and Sharing: Discover how to collaborate with others using Power BI, share reports and dashboards securely, and distribute insights across your or
- Real-World Applications: Apply your learning to real-world scenarios through hands-on exercises and projects, gaining practical experience in data analysis, vis”
Source: Udemy.com
Source: #udemy
Link đăng ký miễn phí vĩnh viễn dành cho 120 đăng ký đầu tiên trong hôm nay (free for 120 enrolls today), 01.7.2023: https://www.udemy.com/course/mastering-microsoft-power-bi-from-beginner-to-advanced/?couponCode=FREEPOWERBI
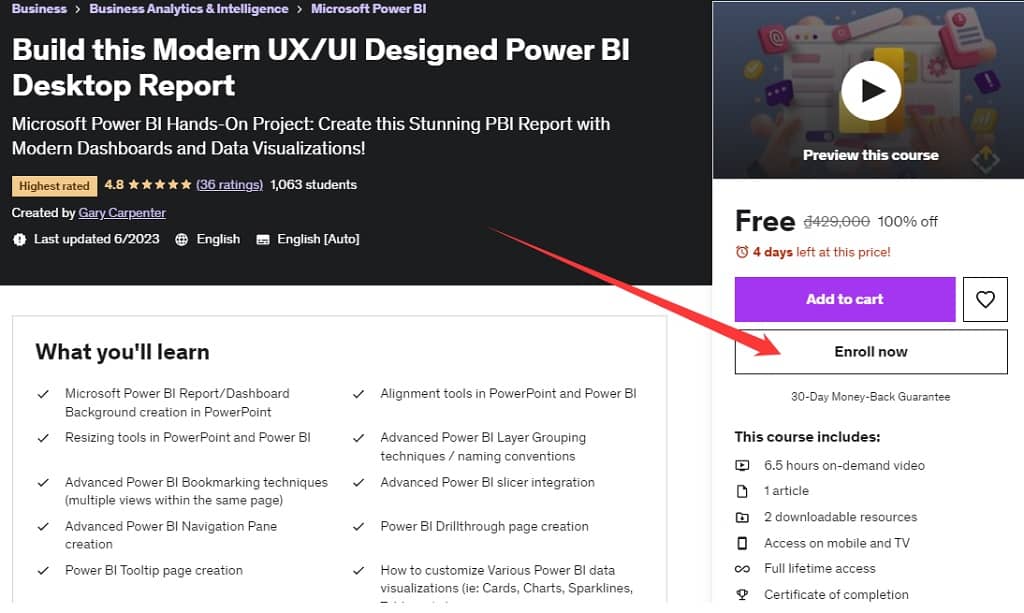
UX/UI Designed Power BI Desktop Report
Build this Modern UX/UI Designed Power BI Desktop Report. Microsoft Power BI Hands-On Project: Create this Stunning PBI Report with Modern Dashboards and Data Visualizations!
Source: Udemy.com
- 6.5 hours on-demand video
- 1 article
- 2 downloadable resources
- Access on mobile and TV
- Full lifetime access
“What you’ll learn
- Microsoft Power BI Report/Dashboard Background creation in PowerPoint
- Alignment tools in PowerPoint and Power BI
- Resizing tools in PowerPoint and Power BI
- Advanced Power BI Layer Grouping techniques / naming conventions
- Advanced Power BI Bookmarking techniques (multiple views within the same page)
- Advanced Power BI slicer integration
- Advanced Power BI Navigation Pane creation
- Power BI Drillthrough page creation
- Power BI Tooltip page creation
- How to customize Various Power BI data visualizations (ie: Cards, Charts, Sparklines, Tables, etc.)
- Custom Power BI theme creation
- Utilization of icons / animated icons in Power BI reports
- Website / web app like designed page principles will be explored (home page / help page, headers, footers, etc.)
Create Next Level Microsoft Power BI Reports / Dashboards
Are you a hands-on learner who thrives on jumping right into action? Do you recognize the importance of delivering an exceptional user experience with a polished Power BI report interface to ensure that end-users engage with your valuable insights? Are you eager to master the art of creating cutting-edge Power BI reports that incorporate proven UI/UX design principles?
If you answered “yes” to any of these questions, then look no further because this course is tailor-made for you! Brace yourself to embark on a transformative journey where you’ll create a stunning, modern UX/UI designed Power BI report from scratch, all under my personal guidance. No matter if you’re a seasoned Business Intelligence data analyst, a Power BI developer, or simply someone keen to refine your data visualization storytelling skills in Power BI, this course is your ultimate gateway to unlocking the potential of this dynamic tool.
This isn’t just any ordinary course. It’s a unique and unparalleled Power BI project-based experience where you’ll shadow my every move as we construct this clean, modern Power BI report from the ground up. Say goodbye to wishing you could witness the creation of captivating Power BI dashboards because, in this course, you’ll be an active participant, following step by step as we bring this remarkable UX/UI designed report to life.
This is not a Power BI course that covers theory nor digs into the “why” behind the choices we’re making. This is rather a “jump right in without wasting time / let’s build!” guided course where we will create an example Power BI report together step by step.
Don’t miss out on this unique opportunity to enhance your Power BI expertise and acquire the skills to captivate audiences with visually stunning reports. Enroll now and join me on this exciting journey as we build this show-stopping Power BI report together!
Who this course is for:
- Anyone who builds Microsoft Power BI reports and wants hands-on experience in creating modern Power BI reports that utilize proven UX/UI design principles.
- Anyone currently working in Power BI such as BI Data Analysts, Power BI Report Developers, IT Power BI architects, etc.
- Anyone who wants to quickly learn some high-level Power BI design techniques they can utilize on their next Power BI report.
- Anyone who wants to pursue a career path that involves creating next level Power BI reports and Dashboards that wow your end-users, help you stand out and get recognized, and most importantly are utilized by your end-users.”
Source: Udemy.com
Link đăng ký miễn phí vĩnh viễn dành cho 120 đăng ký đầu tiên trong hôm nay (free for 120 enrolls today), 23.7.2023 https://www.udemy.com/course/modern-powerbi-report-build/?couponCode=E2F19B50C224B0277C27
Master Microsoft Power BI in 21 Days Free
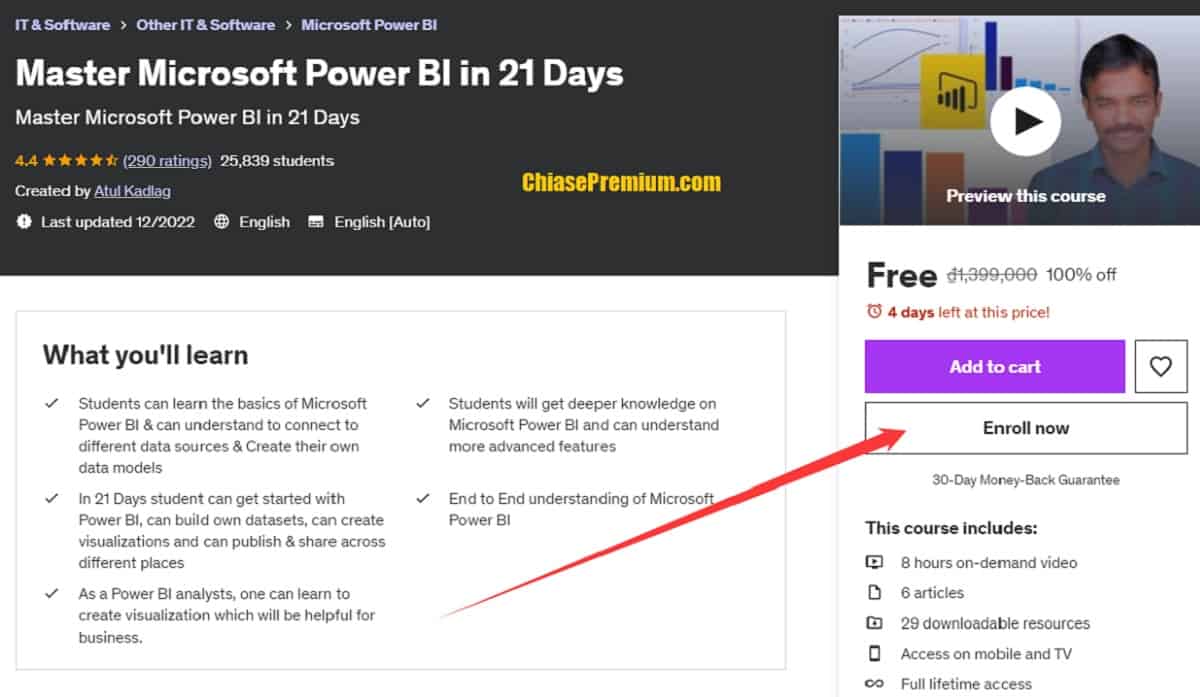
- 8 hours on-demand video
- 6 articles
- 29 downloadable resources
- Access on mobile and TV
- Full lifetime access
- Certificate of completion
“If you want to learn Microsoft Power BI from the basics if you want to improve your analytical skills which have vast demand in the market.
Following are the topics you are going to learn from in this course.
- What is Power BI?
- What technology or toolsetis needed to learn Power BI?
- Why do we needPower BI?
- Different componentsin the Power BI area.
- What is Power BI Desktop? How to start using it? How to create the projectsin Power BI Desktop?
- How to connect to a different databasein Power BI Desktop?
- Understand Query Editor and how to useit?
- How to create Data Model? How to create relationships?
- Understand different relationship types, Cardinality and join Kindswith Practical example
- How to create yourFirst Visuals?
- What are different visualsyou can create, what are different formatting capabilities that can be used to make the most of the visuals?
- Learn about Microsoft Power BI service?
- How to Move your local projectcreated in Power BI Desktop to Cloud?
- How to create different dashboards? How to publish
- How to share and collaborate your applications with other users.
- Explore all aspects of Microsoft Power BI Pro service.
- What is DAX? DAX vs M-Language
- Which one to use? DAX or M-Language
- Implement DAX formula and M-languagepractically
- What is Power BI Mobile?
- How to set upPower BI Mobile? How to access different reports/dashboards in Power BI Mobile?
- What are Custom Visuals and what’s it used?
- Tools and technologiesneeded to create Custom visuals?
- How to bind real datawith Custom visuals.
- all these with theory and practical examples.”
Source: Udemy.com
Link đăng ký miễn phí vĩnh viễn dành cho 120 đăng ký đầu tiên trong hôm nay (free for 120 enrolls today, 25/9/2023): https://www.udemy.com/course/master-microsoft-power-bi-in-21-days/?couponCode=LIMITED7
Full 4 khóa học Power BI (Spanish)
Cập nhật 30/10/2023: Chia sẻ link đăng ký miễn phí vĩnh viễn 04 khóa học Power BI hay từ một tác giả người Tây Ban Nha. Link đăng ký là vĩnh viễn, dành cho 120 đăng ký đầu tiên (cho mỗi khóa học).
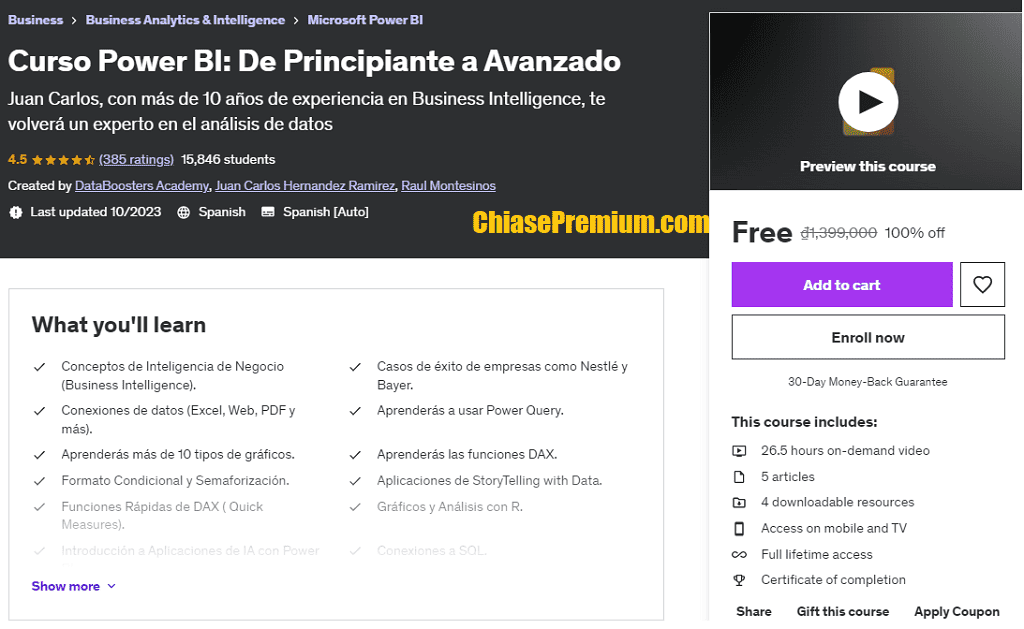
- Curso Power BI: De Principiante a Avanzado
Juan Carlos, con más de 10 años de experiencia en Business Intelligence, te volverá un experto en el análisis de datos.
- Power BI DAX: Aprende las funciones más avanzadas
Vuélvete un profesional de Power BI y del Business Intelligence
https://www.udemy.com/course/power-bi-dax-avanzado/?couponCode=FB-OCT-2023_OFF
- Power BI: Empieza desde cero
Aprende con Power BI a darle valor a los datos
https://www.udemy.com/course/power-bi-desde-cero/?couponCode=FB-OCT-2023_OFF
- Power BI: 8 Proyectos reales para volverte un master
Vuélvete un experto del Business Intelligence y extrae valor de los datos
Complete Power BI Practical Masterclass
Complete Power BI Practical Masterclass in Just 210 Minutes. Learn Microsoft Power BI Desktop and Service Training Course, Hands-On Project, 50+ Learning Topics, Step-By-Step eBook. source: udemy.com
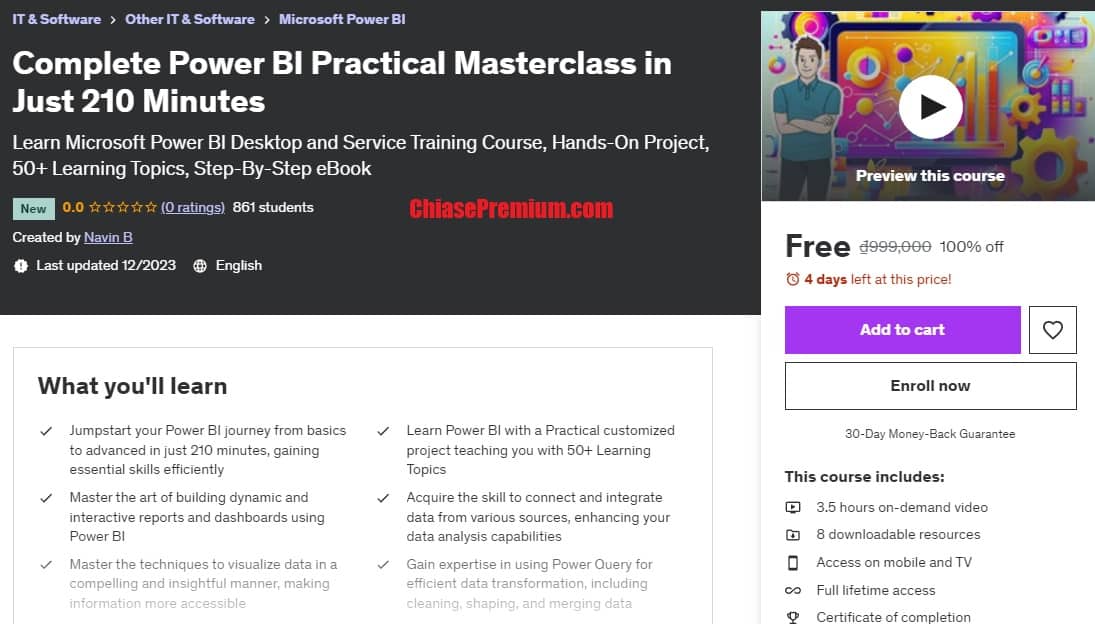
Khóa học Power BI từ cơ bản đến nâng cao chỉ trong 210 phút
Khóa học này sẽ giúp bạn:
- Tạo báo cáo và bảng thông tin năng động và tương tác
- Kết nối và tích hợp dữ liệu từ nhiều nguồn
- Trực quan hóa dữ liệu một cách hấp dẫn và sâu sắc
- Chuyển đổi dữ liệu hiệu quả
- Lập mô hình dữ liệu nâng cao
- Sử dụng công thức DAX
- Tìm hiểu ngôn ngữ M
- Tạo hơn 10 hình ảnh trực quan
- Xuất bản dự án Power BI trên đám mây
- Tạo, chia sẻ và cập nhật Bảng điều khiển
Khóa học được thiết kế cho:
- Người mới bắt đầu với Power BI
- Người dùng Power BI muốn nâng cao kỹ năng
Ưu điểm của khóa học:
- Thời lượng ngắn gọn, hiệu quả
- Dễ hiểu, phù hợp với người mới bắt đầu
- Nội dung phong phú, bao gồm các chủ đề từ cơ bản đến nâng cao
- Được hướng dẫn bởi các chuyên gia Power BI
Link đăng ký miễn phí vĩnh viễn dành cho 120 đăng ký đầu tiên trong hôm nay (free for 120 enrolls today), 17/02/2024: https://www.udemy.com/course/complete-power-bi-practical-masterclass-beginner-advanced-course/?couponCode=17FEBDISCOUNT
Zero to Hero in Data Visualization using Power BI
Power BI: Zero to Hero in Data Visualization using Power BI. Make data models, prepare data using Power Query, create charts & reports and do advanced analysis using DAX in Power BI. source: udemy.com
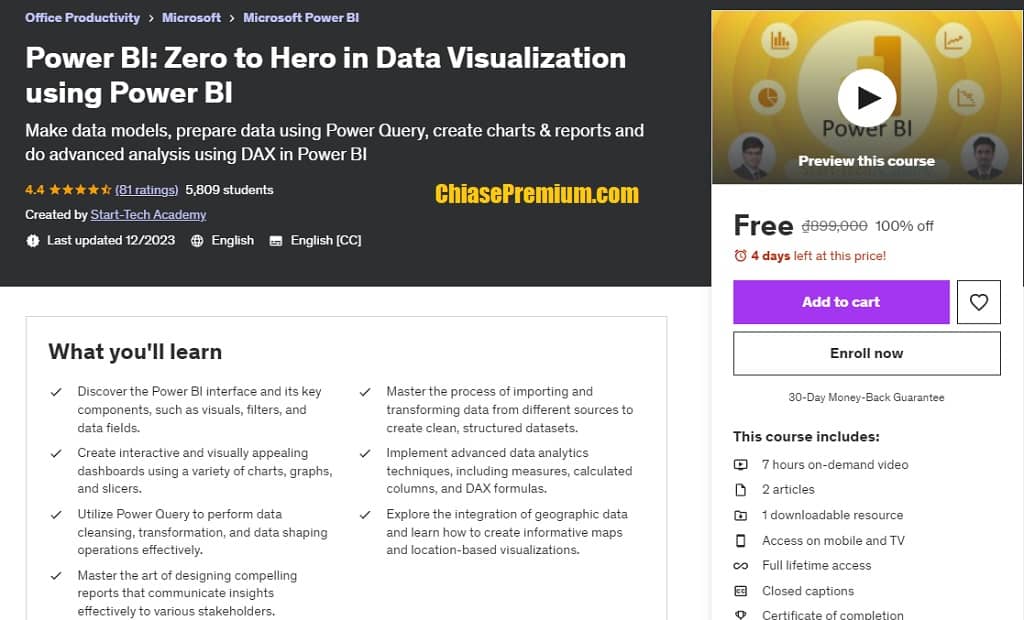
- “Discover the Power BI interface and its key components, such as visuals, filters, and data fields.
- Master the process of importing and transforming data from different sources to create clean, structured datasets.
- Create interactive and visually appealing dashboards using a variety of charts, graphs, and slicers.
- Implement advanced data analytics techniques, including measures, calculated columns, and DAX formulas.
- Utilize Power Query to perform data cleansing, transformation, and data shaping operations effectively.
- Explore the integration of geographic data and learn how to create informative maps and location-based visualizations.
- Master the art of designing compelling reports that communicate insights effectively to various stakeholders.” source: udemy.com
Link đăng ký miễn phí vĩnh viễn dành cho 120 đăng ký đầu tiên trong hôm nay (free for 120 enrolls today), 20/12/2023: https://www.udemy.com/course/power-bi-starttech/?couponCode=CHRISTMASGIFT
Data Magic Power BI + Tableau
Mastering Data Magic: Power BI + Tableau + SQL , Analytics
Data Analytics with Power BI , Tableau and SQL. source: udemy.com
- “Introduction to Power BI
- How to download and Install Power BI Desktop
- Understanding Interface
- Data Sources and Uploading Sample Data
- Building Charts
- Visual Interactions” source: udemy.com
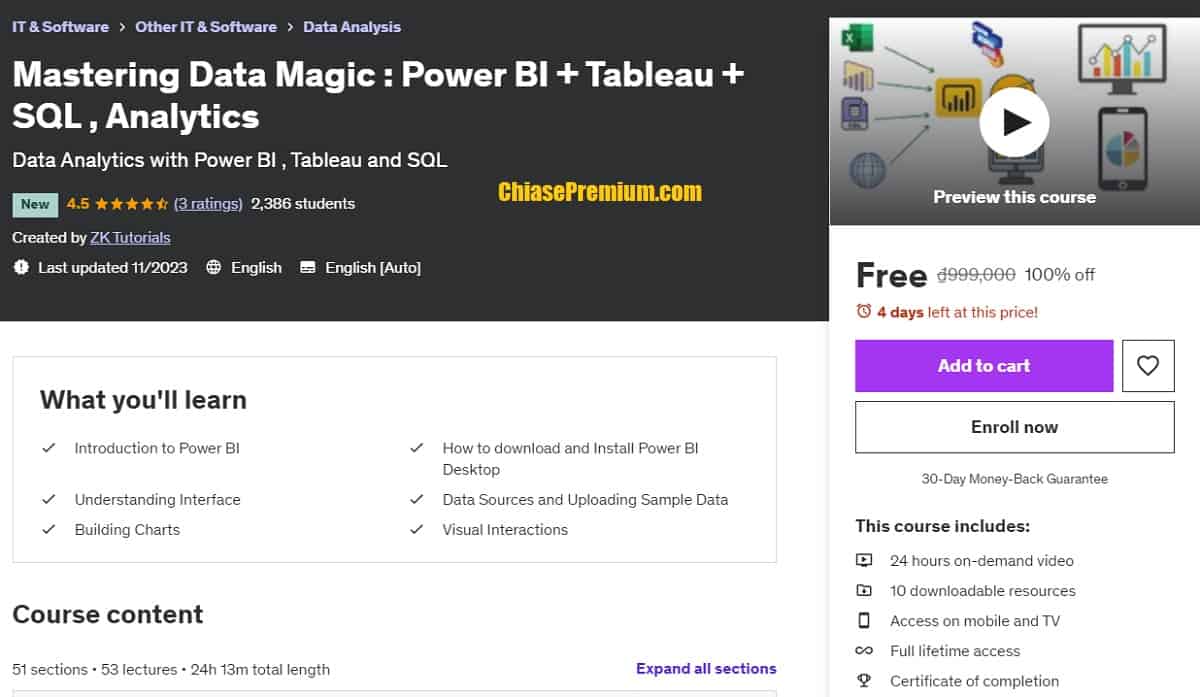
Link đăng ký miễn phí vĩnh viễn dành cho 120 đăng ký đầu tiên trong hôm nay (free for 120 enrolls today), 23.12.2023: https://www.udemy.com/course/mastering-data-magic-power-bi-tableau-analytics/?couponCode=DATA_FREE
Power BI and Tableau for Data Visualization [2-in-1 Bundle]
Learn the top 2 data visualization tools – Power BI and Tableau in 1 course | Beginner friendly | Basic to Advance Level. source: udemy.com
![Power BI and Tableau for Data Visualization [2-in-1 Bundle]](https://chiasepremium.com/wp-content/uploads/power-bi-and-tableau-for-data-visualization.jpg)
- 17.5 hours on-demand video
- 2 articles
- 3 downloadable resources
- Access on mobile and TV
- Full lifetime access
What you’ll learn
- “Connect and Integrate various data sources into Power BI and Tableau, including CSV files, SQL databases, and cloud storage services
- Manipulate and Transform Data using Power Query in Power BI, mastering skills such as merging, appending, and pivoting data for optimal analysis
- Create Advanced Data Models in Power BI, understanding relationships, cardinality, and different schema types like Star and Snowflake
- Design Comprehensive Dashboards using both Power BI and Tableau, learning to effectively communicate data insights through visual storytelling
- Develop Complex Charts and Graphs, including bar, line, and scatter plots in Power BI and Tableau, enhancing the ability to illustrate data trends and patterns
- Perform In-depth Data Analysis using DAX functions in Power BI and calculated fields in Tableau, enabling sophisticated data manipulation and insight generation
- Utilize Advanced Visualization Techniques in Tableau, such as creating custom hierarchies, dual combination charts, and Geo charts etc.
- Implement Effective Data Filtering and Sorting Techniques in both Power BI and Tableau, allowing for focused and precise data exploration
- Publish and Share Interactive Reports and Dashboards, gaining skills in saving, sharing, and presenting data visualizations in professional formats.” source: udemy.com
Link đăng ký miễn phí vĩnh viễn dành cho 120 đăng ký đầu tiên trong hôm nay (free for 120 enrolls today), 18/1/2024: https://www.udemy.com/course/power-bi-and-tableau-for-data-visualization/?couponCode=LEARNING4FREE
Microsoft Power BI PL-300
Microsoft Power BI – beginners to advance Level Exam PL-300.
Master the Microsoft Power BI from beginners to advance level – Work on real world project – Align with PL-300 Exam. source: udemy.com
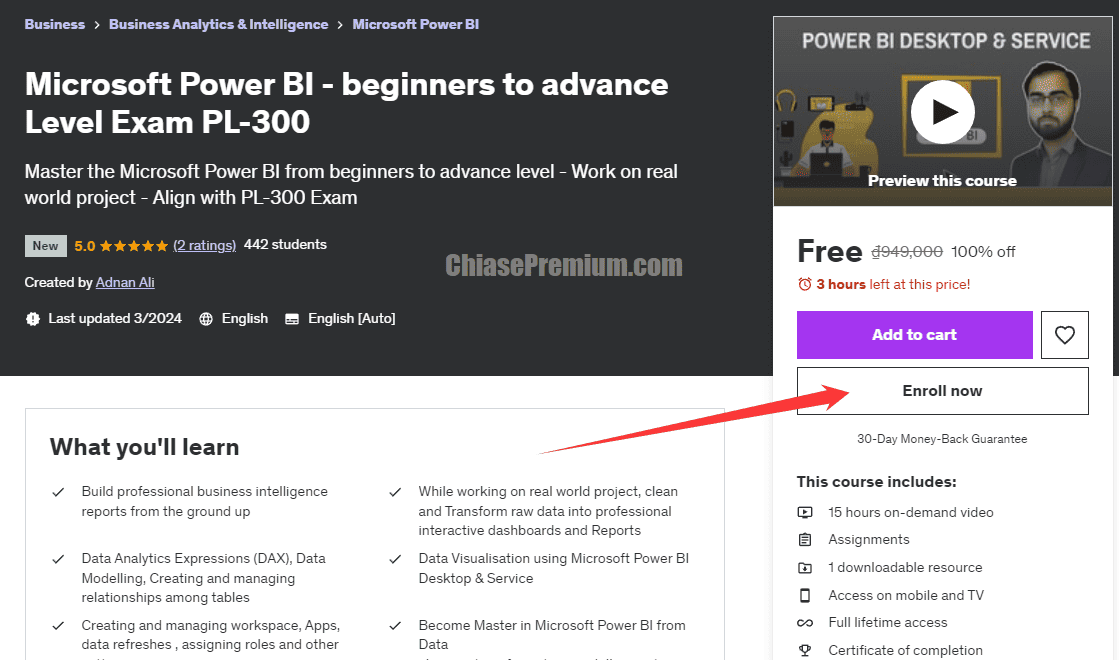
- 15 hours on-demand video
- Assignments
- 1 downloadable resource
“What you’ll learn
- Build professional business intelligence reports from the ground up
- While working on real world project, clean and Transform raw data into professional interactive dashboards and Reports
- Data Analytics Expressions (DAX), Data Modelling, Creating and managing relationships among tables
- Data Visualisation using Microsoft Power BI Desktop & Service
- Creating and managing workspace, Apps, data refreshes , assigning roles and other settings
- Become Master in Microsoft Power BI from Data cleaning,transformation,modelling,writing DAX, visualisation, deployment till managing”
Link đăng ký miễn phí vĩnh viễn dành cho 120 đăng ký đầu tiên trong hôm nay (free for 120 enrolls today), 26/3/2024: https://www.udemy.com/course/microsoft-power-bi-desktop-service-align-with-pl-300/?couponCode=FREE_PROMOTION
Chú ý: tất cả các khóa học trên blog đều được chia sẻ miễn phí, đăng ký sử dụng vĩnh viễn. Tuy nhiên, Udemy và tác giả khóa học thường chỉ dành ưu đãi miễn phí vĩnh viễn cho khoảng 120 đến 150 đăng ký đầu tiên trong ngày.
Để không bỏ lỡ đăng ký ưu đãi miễn phí mới nhất, bạn có thể theo dõi trên Facebook Page hoặc đăng ký nhận bản tin ChiasePremium dưới bài viết nhé.
→ Đăng ký thêm các khoá học Udemy miễn phí khác:
- Khóa Học Cơ Sở Dữ Liệu Từ Cơ Bản Đến Nâng Cao 2023
- Khóa học SQL 2023 miễn phí (chia sẻ tổng hợp)
- Khóa học NLP – Lập trình ngôn ngữ tư duy
- Golang là gì? Share khóa học Golang hay nhất từ Udemy
- Khóa học ChatGPT miễn phí tốt nhất (tổng hợp)
- Khóa học Canva miễn phí – Top Canva Courses Online 2023
- Khóa học tài chính cá nhân tốt nhất: Kiếm tiền, tiết kiệm và đầu tư
- Full tài liệu học lập trình PHP – Khóa học lập trình PHP
- Khóa học Kaizen: Continuous Improvement – cải tiến liên tục (share)
- Khóa học Trí tuệ nhân tạo AI có chứng chỉ (free)


Chia sẻ link đăng ký miễn phí vĩnh viễn khoá học (áp dụng cho 1000 đăng ký đầu tiên):
PL-300 Microsoft Power BI Data Analyst Practice Tests – Full Exam Simulations included + explanations | Pass the PL-300 Microsoft Power BI Data Analyst exam confidently!
https://www.udemy.com/course/pl-300-microsoft-power-bi-data-analyst-practice-tests/?couponCode=IMZILEN
Cập nhật 28.5.2022.
“Google Data Studio Complete Beginners to Advanced Tutorial – Learn the best Cloud based BI & Data Visualization tool – Google Data Studio – & Create Exceptional Reports in minutes”
Source: udemy.com
https://www.udemy.com/course/google-data-studio-complete-beginners-to-advanced-tutorial/?couponCode=MAY003
Chia sẻ link đăng ký vĩnh viễn khóa học:
“SAP Business Analytics Essential Training | Free | Full lifetime access”
Link đăng ký free (1000 slots):
https://www.udemy.com/course/sap-bi-bo/?couponCode=DA560CA9D9C7A31FFB8D
Cập nhật 20/11/2021
Chia sẻ link đăng ký miễn phí các khóa học sau (và sử dụng vĩnh viễn).
1. Data Science and Analytics with AWS Quicksight and Power BI
Learn to create Visualization Charts and Reports | Data Preparation | Finding Insights from Data
https://www.udemy.com/course/data-science-and-analytics-with-aws-quicksight-and-power-bi/
2. Data Analyst: Power BI | SSRS | SSIS | SSAS | SQL Server
Perform Data Analysis & Visualization with: Power BI | SSRS | SSIS | SSAS | SQL Server
https://www.udemy.com/course/data-analyst-power-bi-ssrs-ssis-ssas-sql-server/?couponCode=747E0D700B75D827C55F
3. Data Engineer/Data Visualisation – Tableau| PowerBI | Python
Transform and Visualize Data
https://www.udemy.com/course/data-engineerdata-visualisation-tableau-powerbi-python/?couponCode=2F15B4F36694633AFBB8
4. Design and Implement a Data Warehouse: | SSIS | SSAS | SSRS
Build a Data Warehouse Solution
https://www.udemy.com/course/design-and-implement-a-data-warehouse-ssis-ssas-ssrs/?couponCode=5F6EA85248FE3D983222
Cập nhật 09/11/2021:
Chia sẻ link đăng ký miễn phí khóa học:
“Data Reporting Analyst – Tableau | Power BI | Excel |SSRS. Build Reports using: Tableau | Power BI | Excel |SSRS” (Source: Udemy.com)
Link đăng ký miễn phí và sử dụng vĩnh viễn (áp dụng cho 1000 slot đầu tiên):
https://www.udemy.com/course/data-reporting-analyst-tableau-power-bi-excel-ssrs/?couponCode=790A62F7323A863036BD
Cập nhật 07/11/2021:
“Data Visualization with Python and Power BI” (Source: Udemy.com)
Link tham gia khóa học miễn phí vĩnh viễn: https://www.udemy.com/course/data-visualization-with-python-and-power-bi/
Chia sẻ link đăng ký giảm giá 100% khóa học:
“The Complete Microsoft Excel Pivot Tables and Pivot Charts. Excel Charts, Excel Analytics, Excel Pivot Table , Excel Pivot Charts, Excel Dashboard, Excel Data Analysis & Reporting ”
Thời gian miễn phí: trong ngày 19/10/2021:
Link đăng ký: https://www.udemy.com/course/the-complete-microsoft-excel-pivot-tables-and-pivot-charts/?couponCode=MUBEEN12345